Ask a media buyer what counts as a good CTR on Meta and most will answer with a number. Usually 1%, sometimes last year's platform average lifted from a benchmark report. That number gets repeated in audits, in onboarding docs, in the slide that says kill anything under 1%.
It is also the most expensive piece of shorthand in Facebook advertising. Two things break it.
"CTR" isn't one metric in Ads Manager. It's three, and each measures a different behaviour. And a CTR that drops is more often auction pressure or a post-click leak than creative fatigue, so the reflex fix, swapping the creative, treats a cause that usually isn't there.
A defensible read starts somewhere else: name the column, name the objective and placement, then run a diagnostic before spending a single hour on new assets.
Table of Contents
- Which Facebook Ads CTR Metric to Trust
- CTR Benchmarks by Objective and Industry
- Placement CTR Hidden Inside a Blended Average
- How to Tell Fatigue from a Broken Funnel
- Creative and Targeting Changes That Lift CTR
- What the Same CTR Means in Three Accounts
- Decide Whether to Replace the Ad or the Funnel
Which Facebook Ads CTR Metric to Trust
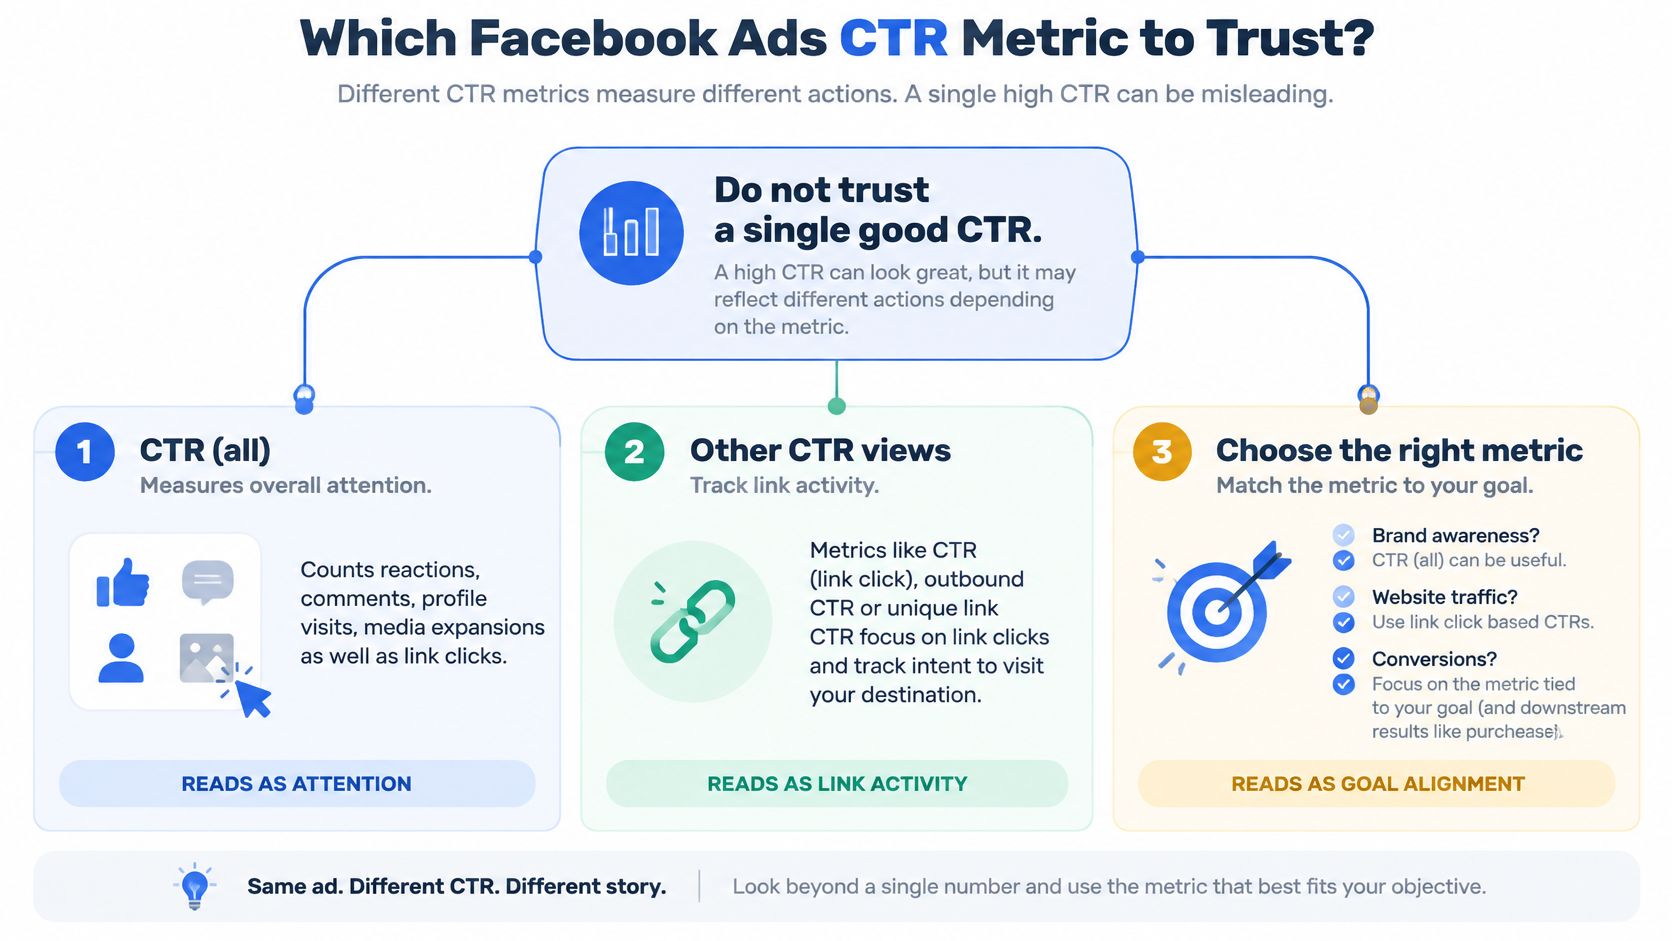
The first thing to distrust is the headline number. Ads Manager reports CTR at more than one level, and the columns don't count the same event. The guide to reading Facebook CTR from Relevantaudience draws the distinction that most benchmark articles skip: the platform reports CTR (all), link CTR and outbound CTR, and only one of them matches the job most campaigns are hired to do.
- CTR (all) divides clicks (all) by impressions, and clicks (all) folds in reactions, comments, shares, profile visits and taps to expand media alongside link clicks. A strong number here means the creative stopped the scroll. It says nothing about whether anyone left the feed.
- Link CTR counts clicks on links, which includes destinations that never open a browser: Instant Forms, Instant Experiences and other on-platform surfaces. It's the correct column when the click itself is the conversion.
- Outbound CTR counts only the clicks that leave Meta for a website, app store or app. When the objective is traffic to a product page, this is the column that belongs beside sessions, add-to-cart rate and CPA.
Match the column to the job
Use CTR (all) to judge whether the hook works. It's a creative diagnostic, not a performance metric, and it should never appear in a client report next to revenue.
Use link CTR when the destination lives inside Meta, typically a lead form or an Instant Experience. Optimising a website traffic campaign against link CTR inflates the result, because some of those clicks ended on a form Meta hosted.
Use outbound CTR whenever a session on your domain is the point. That's the number that reconciles with analytics, and it's the one that should trigger or block a creative decision.
Practical rule: if the ad's job is to send someone to a product page, outbound CTR is the only click rate that belongs in the scorecard. The other two are diagnostics for why it moved.
Meta publishes no universal threshold for any of the three, and a rate that looks ordinary for broad prospecting can be embarrassing for a warm retargeting pool. Third-party averages that never name the numerator will not match your export, because they're often counting a different event. Record objective, placement, audience, format and funnel stage on every comparison, and remember that a campaign below the category average is still viable when conversion rate and order value carry the return.
CTR Benchmarks by Objective and Industry
The most useful contemporary reference comes from an analysis of 1,180 Facebook campaigns that ran between April 1, 2024, and June 30, 2025, published in the WordStream Facebook Ads benchmarks guide. Read it as a lookup table, not a target list.
| Segment | Average CTR | What the row is for | Study window |
|---|---|---|---|
| Traffic campaigns, all industries | 1.71% | Directional link or traffic CTR, not a profit target | April 2024 to June 2025, 1,180 campaigns |
| Traffic campaigns, prior year | 1.57% | Shows the 0.14 point, about 8.9% year-over-year rise | Prior year to the 2025 study |
| Lead generation, all industries | 2.59% | Higher-intent audiences and native lead forms | April 2024 to June 2025 |
| Shopping, Collectibles and Gifts | 4.13% | High end of reported traffic CTR | Same industry cut |
| Finance and Insurance | 0.98% | Low-intent, high-competition category | Same industry cut |
| Physicians and Surgeons | 0.83% | Professional-services floor, not an account failure by itself | Same industry cut |
| Automotive Repair, Services and Parts | 0.80% | Lowest reported category in this set | Same industry cut |
Which row a traffic buyer and a lead buyer should use
If you're running a traffic objective into a product or landing page, the row that matters is the 1.71% traffic average, and the honest comparison is your outbound CTR against it, not your CTR (all). Anything in the low 1s is unremarkable, not broken. The WordStream Facebook ads benchmarks report also tracks the trend behind that figure, putting the prior-year traffic average at 1.57%, an increase of roughly 0.14 percentage points, or about 8.9% year over year. Click behaviour is drifting upward as creative gets better and inventory gets more expensive, so a rate that was strong in 2023 may be average now.
If you're running leads, ignore the traffic row entirely. Lead campaigns averaged 2.59% in the same window, partly because they often target higher-intent audiences and use native lead forms that remove the landing-page step. A 1.8% link CTR into an Instant Form is a soft result against that baseline; a 1.8% outbound CTR into a long application form may be outstanding.
The industry spread explains why a single platform-wide target misleads. Shopping, Collectibles and Gifts reached 4.13%, roughly five times the 0.80% recorded in Automotive Repair, Services and Parts, with Physicians and Surgeons close behind at 0.83% and Finance and Insurance at 0.98%. None of those categories is doing anything wrong. The intent of the audience, the visual demonstrability of the product and the level of auction competition all differ.
Watch the vintage as closely as the numerator. The DataBox Facebook ads benchmark by industry reported a median CTR of 1.49% across all industries in March 2023, with no objective split and no click definition attached. Quoting it against a 2025 outbound figure is comparing two different measurements taken two years apart.
Join the click rate to what happens after it
A rate above the row can still be inefficient if those clicks never convert, and a rate below it can still be the best line in the account. That only becomes visible when the click joins to sessions, add-to-cart rate, conversion rate and CPA.
Enforce consistent UTMs and ad-level naming so the join survives at scale. A name that carries objective, audience and concept lets you pivot a 200-ad batch by hypothesis instead of opening previews one by one. Without that, CTR stays a standalone vanity metric, and every decision built on it inherits the same blindness.
Placement CTR Hidden Inside a Blended Average
A blended account CTR is an average of inventories that behave nothing alike. The mid-2025 compilation in rule1.ai's Facebook ads benchmark roundup shows the spread across eight placements, and it's wide enough that one weak surface can drag a healthy account under a benchmark it never missed.
| Placement | Average CTR | How to use the row |
|---|---|---|
| Instagram Stories | 1.34% | Highest in this set; do not treat it as the Feed target |
| Facebook Feed | 1.11% | Main feed baseline in this compilation |
| Instagram Feed | 1.01% | Close to Facebook Feed; still split it out |
| Facebook Reels | 0.94% | Lower click rate than Feed in this set |
| Facebook Stories | 0.83% | Below feed; judge Stories against Stories |
| Instagram Reels | 0.76% | Do not kill a Reels ad for missing a Feed average |
| Audience Network | 0.58% | Often dilutes a blended CTR |
| Right column | 0.41% | Lowest; exclude it before judging creative |
Read that table before pausing anything. A blended 1% can conceal a Feed ad performing at twice the placement norm and an Audience Network placement dragging the mean down, or the exact reverse. Break down by placement in Ads Manager first, then decide. For a wider look at how each surface behaves across objectives, this breakdown of Facebook ad placements covers where each inventory sits in the funnel.
Cheap clicks are not cheap traffic
A separate cost dataset, reported in MojoDojo's comparison of Reels and Feed costs, makes the same point from the other direction. Keep it apart from the compilation above, because the two are measured differently and averaging them produces nonsense.
- Facebook Feed: 2.4% CTR at $0.72 CPC, with a 35.6% landing-page-view-to-click rate.
- Facebook Reels: 1.3% CTR at $1.48 CPC, but a 40.2% landing-page-view rate, meaning more of its clicks survived the jump.
- Instagram Reels: 1.4% CTR at $1.12 CPC and 37.1% landing-page views.
- Facebook Reels Overlay: 0.4% CTR at $0.61 CPC, yet the highest landing-page-view rate of the four at 41.0%.
The overlay row is the one to sit with. Lowest CTR, cheapest click, best arrival rate. Optimising toward the top-line click rate would have cut the placement that delivers sessions. Compare creatives only when placement, objective, audience, attribution and CTR definition all stay fixed; change two of those and you've measured nothing.
How to Tell Fatigue from a Broken Funnel
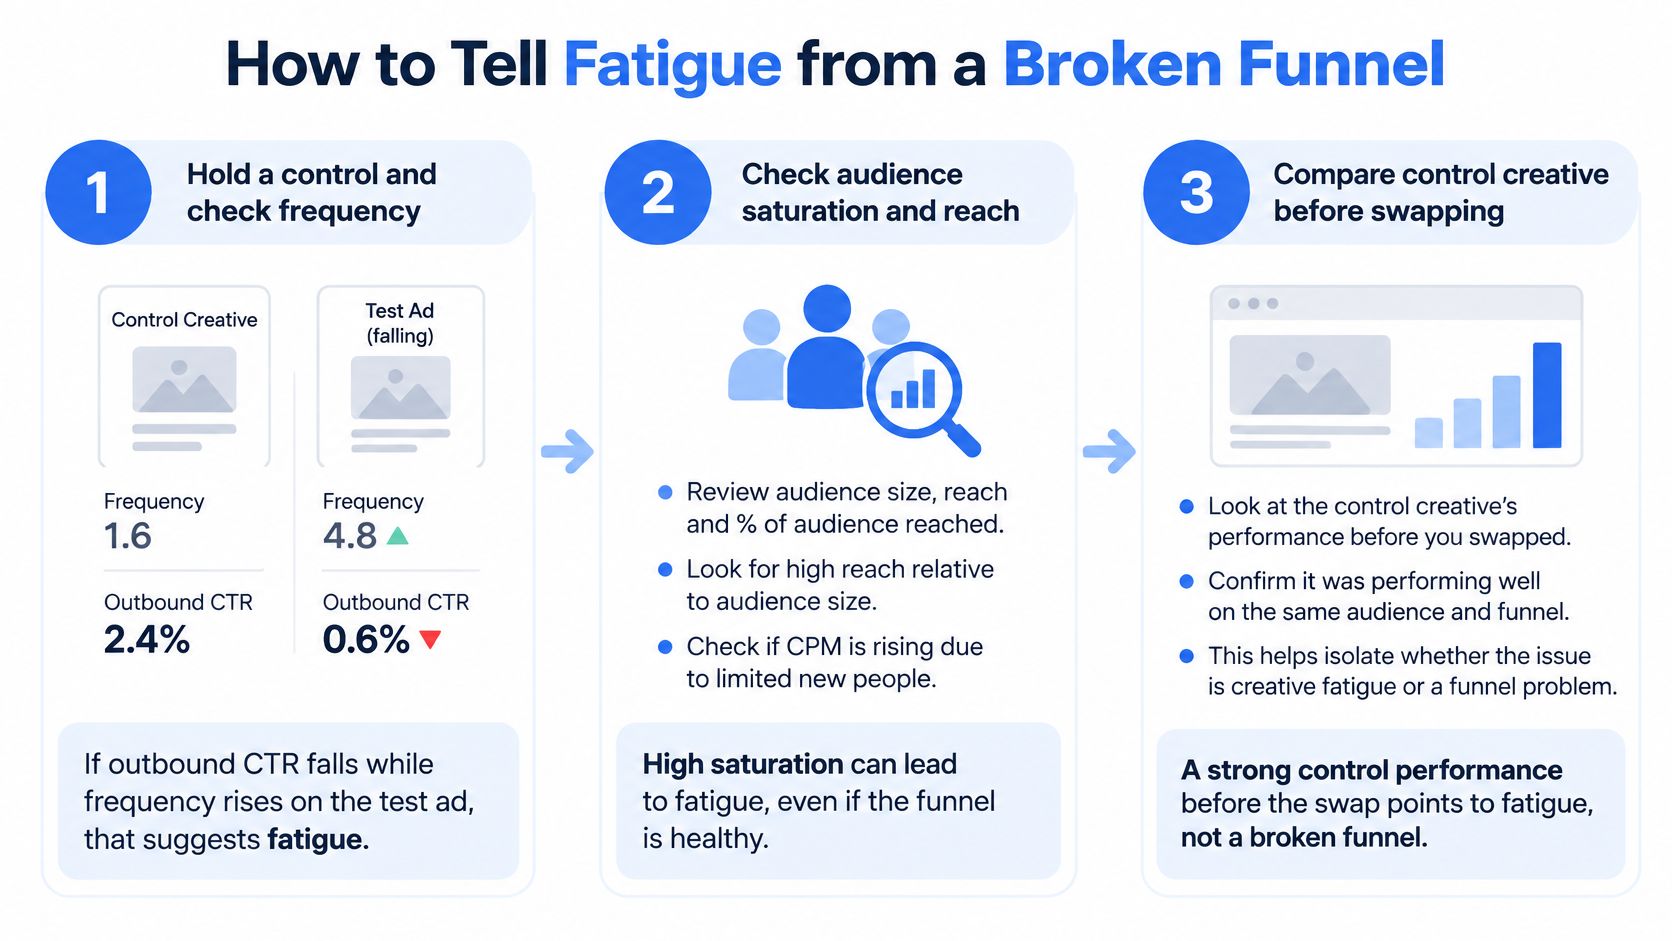
The reflex advice is to replace an ad when CTR falls. That advice assumes the click rate fell because the audience got bored. In practice, the same curve shows up from auction pressure, audience saturation, placement mix, landing-page problems and measurement loss, and the Adtribute glossary entry on CTR is right to frame it as a stage-separation problem rather than a creative one. Replacing a working asset because a competitor entered the auction costs more than a week of mediocre CTR.
Here's the decision tree, compressed.
Run the checks in this order
The sequence matters. Run them out of order and every problem looks like fatigue.
- Hold one control creative and read frequency on the falling ad. If outbound CTR falls while frequency climbs on that ad alone, fatigue is plausible. Frequency climbing across the whole ad set while one ad dies is saturation, which is a budget and audience question.
- Pull CPM for several creatives across the same days. If CPM rises together across unrelated concepts, treat it as auction pressure or seasonality. A hook that worked last month is not suddenly worse because inventory got dearer.
- Check whether CTR held while conversion rate or blended revenue fell. If it did, the creative is fine. Inspect the offer, the page, tracking and the attribution window.
- Compare CTR (all) against outbound CTR. A wide gap means the ad collected engagement without sending anyone anywhere. The promise or the CTA is the problem, not the audience.
- Look at landing-page views per click. If outbound CTR holds and that ratio drops, check page speed and which placement is delivering the click.
Read frequency, CPM, outbound CTR, landing-page view rate, conversion rate and blended revenue as one set. Then map the pattern.
| Pattern | Likely cause | Check before you act | Action |
|---|---|---|---|
| Outbound CTR down and frequency up on one ad | Creative fatigue | Frequency and a held control | Replace that creative, keep the control |
| CTR down on many ads while CPM rises | Auction pressure or seasonality | CPM by ad over the same dates | Do not blame one hook |
| CTR stable, conversion rate or revenue down | Post-click offer, page or attribution | Landing-page view rate, CVR, attribution window | Fix the funnel, not the ad |
| CTR (all) high, outbound CTR low | Engagement without a visit | Both CTR columns side by side | Change the promise or the CTA |
| Outbound CTR steady, landing-page views per click down | Slow page or weak placement mix | LPV rate by placement | Fix speed or cut the placement |
Default action until the frequency test passes: do not replace the ad yet. One concept dying at rising frequency is evidence. Three concepts dying in the same week at rising CPM is a market.
Attributed conversions are not incremental conversions. Meta can report a purchase inside its attribution window for someone who was going to buy anyway, so a healthy CTR and a healthy reported ROAS don't prove the ad caused anything. Privacy restrictions and modelled measurement make that gap wider every year, which is why server-side signal recovery through the Conversions API has become the standard repair when click data and session data stop agreeing. If your numbers split along that line, this walkthrough of conversion tracking on Facebook covers the setup side before you touch creative.
High-volume launches amplify every misdiagnosis. Publish hundreds of variants with dirty names and mixed placements and you'll manufacture a fatigue story out of your own naming. When you need to rebuild the post-click path properly rather than patch a page, the Web Mage funnel-building guide sets out the stage-by-stage structure that makes an offer readable to a cold click.
Creative and Targeting Changes That Lift CTR
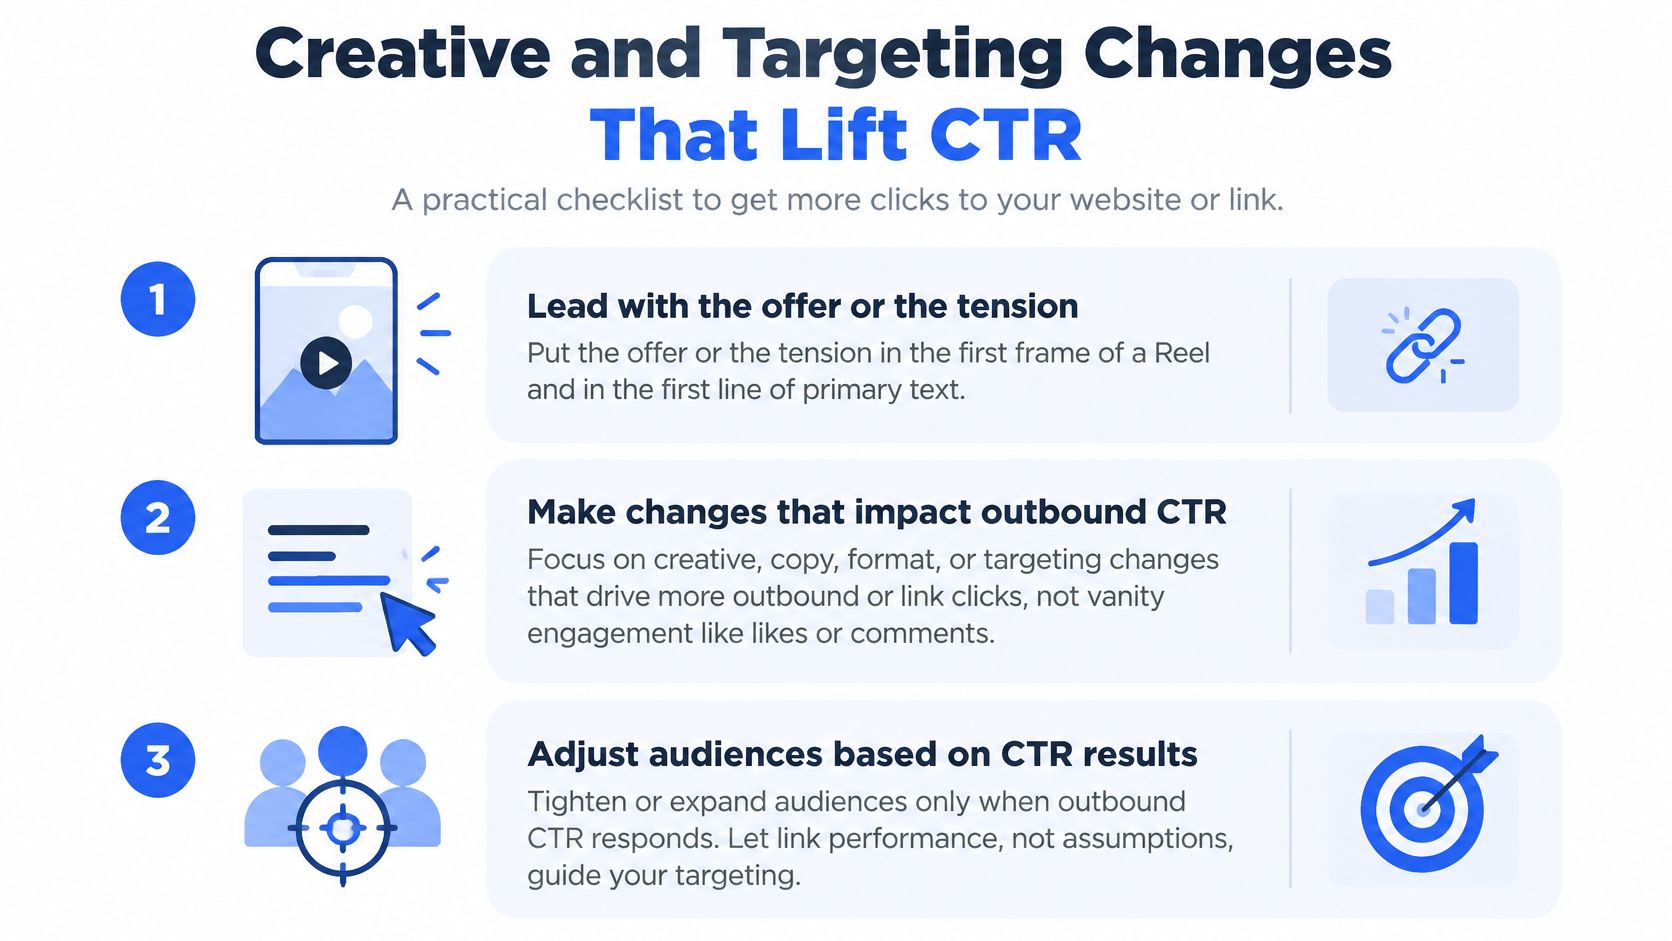
Only two kinds of change matter here: those that move outbound or link CTR, and those that don't. Everything that lifts reactions while outbound CTR stays flat is decoration.
Change one variable against the control
Feed and Reels don't share a hook, so a single asset serving every placement will underperform in at least one of them and you won't know which. Put the offer or the tension in the first frame of a Reel and in the first line of primary text for Feed. Those are different mechanisms, and testing them together hides the answer.
Against the control you held during the diagnostic, test one of three things per round: the opening frame, the headline claim, or the CTA. A full reshoot combined with a new audience gives you a number and no explanation.
Build 9:16 for Reels and Stories and 1:1 or 4:5 for Feed rather than letting one crop serve all four. The aspect ratio changes how much of the frame the hook occupies, which changes the click rate for reasons that have nothing to do with the idea.
Where Advantage+ enhancements quietly rewrite the test
Creative enhancements can alter a tested asset after launch. Standard enhancements, added music and visual touch-ups may be applied at delivery, so a CTR shift you attribute to a copy change can be Meta's own edit of your approved creative.
Turn off the enhancements you didn't design, then recheck them after every edit. Ads Manager can restore defaults when an ad is duplicated or an account setting resets. If you're testing hooks, an auto-applied text variation is a confound, and a confounded test is worse than no test.
Keep targeting and naming clean enough to rank
Never compare a broad prospecting ad set with a retargeting or lookalike ad set. A warm audience should beat the traffic benchmark comfortably; if it doesn't, the creative is introducing itself to people who already know you, which is a message problem.
Keep CBO and ABO structures from mixing learning-limited ad sets into the same CTR ranking, since a set that hasn't reached stable delivery will drag the mean in whichever direction its first day went. If you're producing unique creative at volume, comparing AI UGC video generators is a faster route to enough distinct opening frames than reshooting one concept repeatedly.
Name every ad with objective, audience, placement intent and concept so a 100-ad batch sorts without opening a single preview. Flexible ads can hold several assets in one ad unit; read the asset-level breakdown before crowning an ad ID, because the winning asset inside a losing ad is the most commonly missed result in bulk testing. A tight process here is what separates a readable improvement in click-through rate from a lucky week.
What the Same CTR Means in Three Accounts
Benchmarks only become decisions when you attach them to an objective.
The shopping prospecting campaign at 2.1% outbound CTR. Above the 1.71% traffic average, well under the 4.13% shopping high, and entirely normal. Nothing here needs a new creative. The question is add-to-cart rate: at 2.1% clicks with a weak cart rate, the product page is the project, and making more ads just buys more expensive proof.
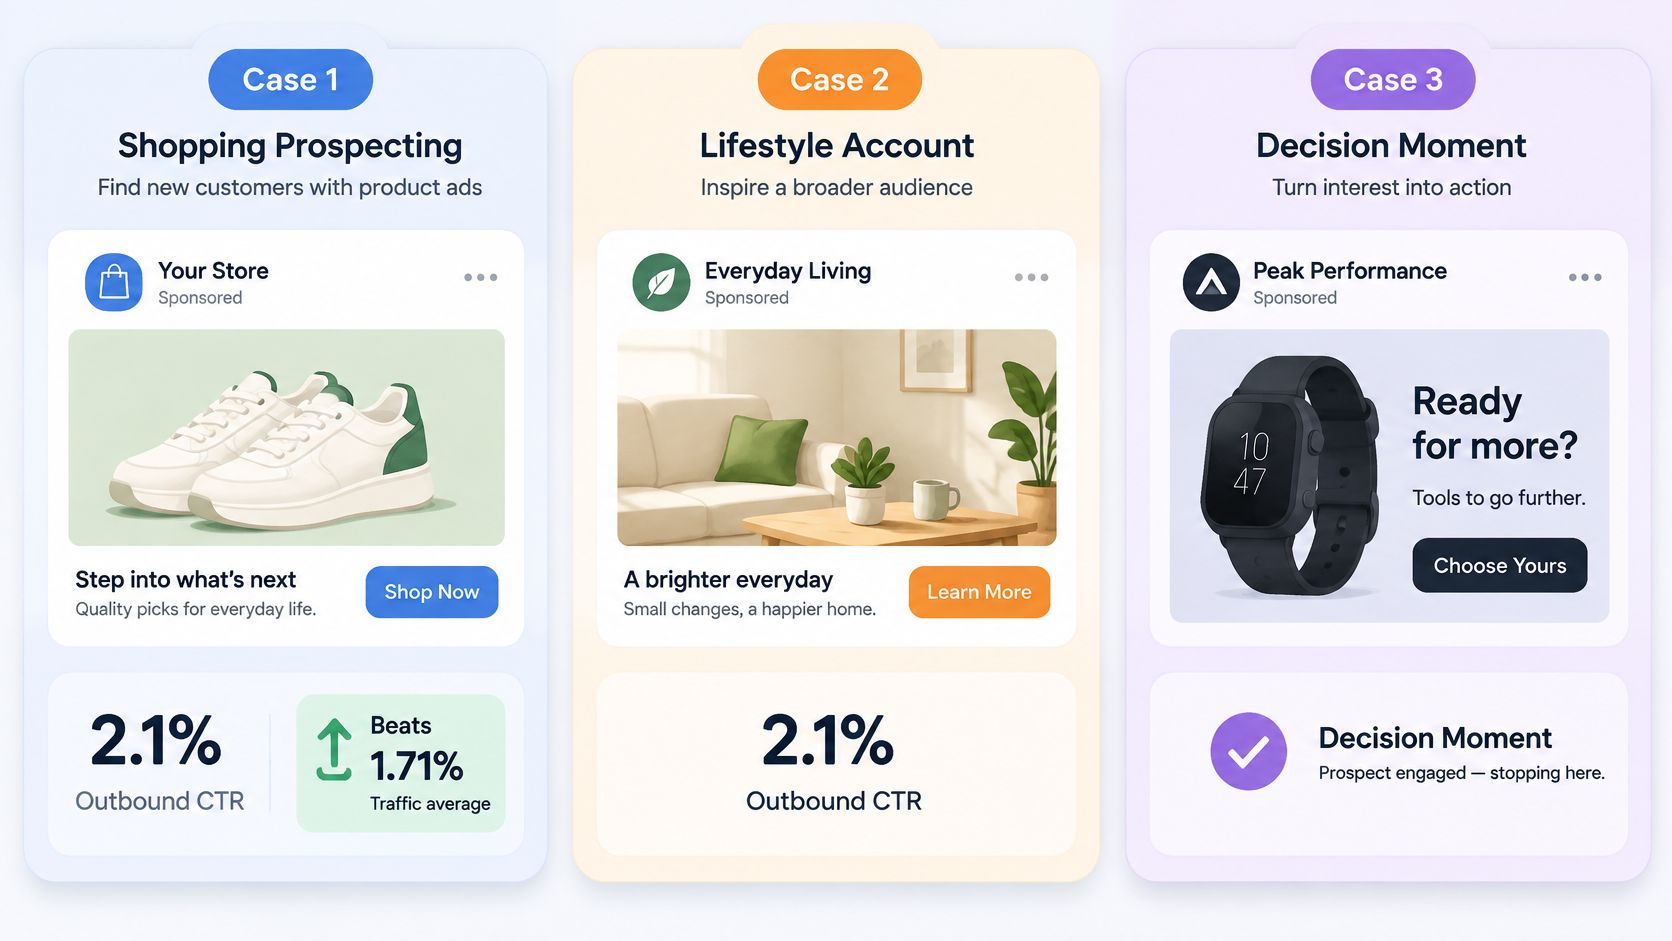
The lead campaign at 1.8% link CTR into an Instant Form. Below the 2.59% lead average. The first suspects are the form length, the qualifier question and the field order, not whether Feed beats Reels. Ask how many fields sit above the submit button before you reshoot anything.
The account averaging 1.0%. Fine against a traffic benchmark until the placement breakdown shows Feed running healthily and Audience Network sitting near its 0.58% placement mark and pulling the blend down. Separate or exclude that placement before writing a new hook.
In all three, the expensive mistake is identical: pausing the top spender because one blended CTR missed a number drawn from a different objective, a different placement or a different click definition.
The rule to apply tomorrow morning: same column, same objective, same placement, then the diagnostic, then a creative change. In that order, every time.
Decide Whether to Replace the Ad or the Funnel
The replace-or-repair rule is short enough to memorise.
If frequency is up and outbound CTR is down on one concept while the control holds, replace that concept and keep the control running.
If CPM is up across the batch, change budget, audience breadth or flight timing. The hook is innocent.
If CTR is holding and revenue isn't, your work is on the landing page, the offer and the attribution setup. Account-level structural questions belong in a wider review, and Scéaled's Meta campaign optimization guide covers those levers without touching creative.
For the next test, launch a small batch against a named control, one placement group at a time, with UTMs and an ad name that encodes objective, audience and concept. The practical friction at that point is volume: Ads Manager makes one-by-one uploads, default settings drift back on, and the naming falls apart somewhere around ad sixty, which is where the comparison goes bad before the auction even starts. Rapid Ads is built for that batch. We're an official Meta marketing partner, we launch an entire batch of ads to Meta in one click, and we're 92.6% faster than doing the same launch inside Meta's interface. Those saved hours are only worth anything because they go back into holding the control and reading placement breakdowns.
You can start on the free plan and run one clean test, then judge the results with the column and the row this guide already set out.
Reading CTR well is mostly a discipline problem, not an analytical one: pick the column that matches the objective, compare it against the row for your industry, then run the frequency and CPM checks before you touch a single asset. Rapid Ads takes the launch work out of that loop, so a batch of 100 ads goes live with consistent naming, clean UTMs and the right aspect ratios in the right ad sets, which means the comparison is valid from day one. Try the free plan at Rapid Ads and run your next placement-level test on data you can trust.