A good CTR for Facebook ads starts with the 1.71% average for traffic campaigns: use 1% to 2% as a directional interpretation range, with the lower end calling for investigation and the upper end looking competitive. Above that range, the result is strong only if acquisition cost and conversion quality hold.
The harder question is whether your reported CTR measures the action you need. A campaign can attract plenty of interactions without sending qualified visitors to your site, and an account-wide average can hide a profitable placement behind a superficially weak click rate.
For media buyers, CTR is an upstream diagnostic, not a standalone KPI. The useful answer to “what is a good CTR for Facebook ads?” requires a defined click metric, a comparable objective, and evidence that the clicks produce business value.
Table of Contents
- CTR (All), Link CTR and Outbound CTR Compared
- Benchmark CTR by Campaign Objective
- Industry Benchmarks and Why One Number Misleads
- Placement Benchmarks and When Low CTR Is Fine
- Factors That Move CTR and How to Diagnose Them
- Reading CTR Against Conversion Rate in a Worked Example
- Set Your Own CTR Target Before You Scale
CTR (All), Link CTR and Outbound CTR Compared
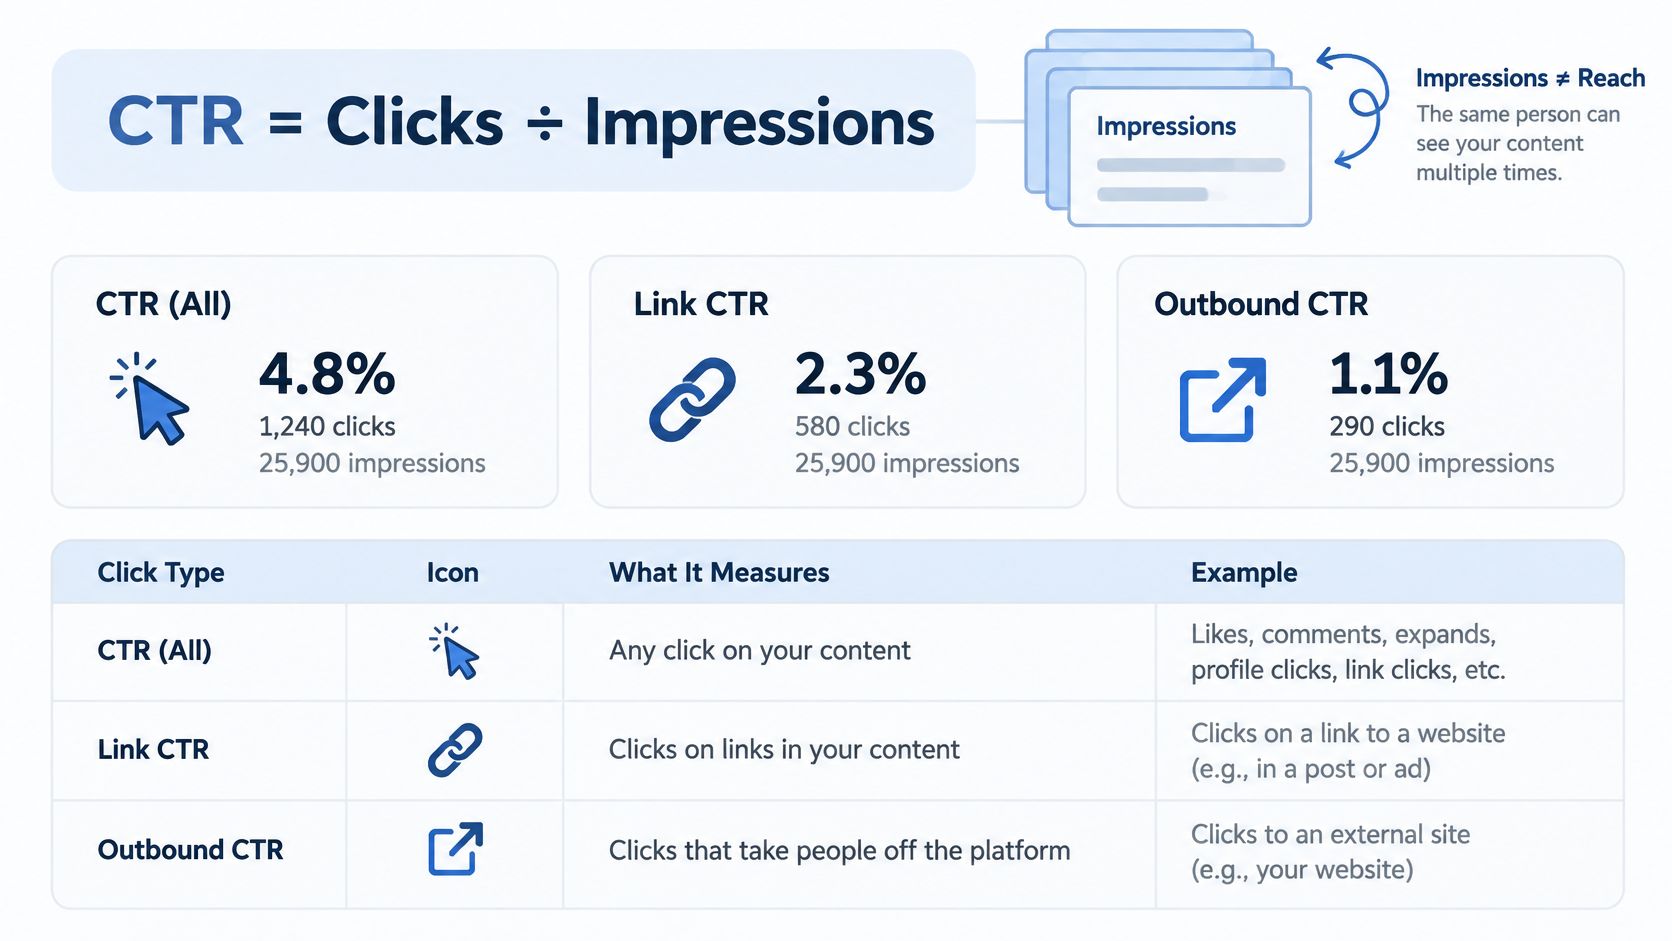
Meta reports several click-through rates in Ads Manager, and each one answers a different diagnostic question. CTR is clicks divided by impressions, expressed as a percentage. Meta's measurement guidance distinguishes impressions from reach: repeated displays to the same person add impressions, so the denominator counts exposures rather than unique people.
The numerator deserves equal scrutiny. Meta separates interactions inside the ad, clicks to advertiser-selected destinations, and clicks that leave Meta properties. The same spend can therefore produce three different rates, and only one of them measures the action a given campaign was built to deliver.
Meta click metrics and when to use each
| Metric | What counts | Best use | Main risk |
|---|---|---|---|
| CTR (all) | Every click inside the ad, including reactions, comments, shares, profile visits and expanded media | Awareness and engagement tests | Inflated by low-intent clicks |
| Link CTR | Clicks to advertiser-selected destinations: websites, app stores, lead forms, Instant Experiences, collections | Traffic and lead campaigns | Lead forms and collections count as link clicks |
| Outbound CTR | Clicks that take users off Meta properties | Landing-page traffic | Narrowest; slower to accumulate on small budgets |
| Landing-page views | Clicks where the destination page loads | Post-click quality check | Relies on page speed and tracking being correct |
The gap between definitions is large enough to flip a verdict. ConversionGems' benchmark data reports approximately 1.90% when all clicks count versus 1.18% when destination clicks count. Judging a link CTR against an all-click benchmark can make a healthy campaign look weak and let a weak campaign pass.
Match the metric to the destination
Use link CTR when the intended destination includes an Instant Form or another on-platform experience. Use outbound CTR when the required action is leaving Meta for your landing page. Outbound CTR confirms the click fired; landing-page views confirm the destination loaded, so the pair belongs side by side.
Practical rule: A campaign sending users to an Instant Form shouldn't fail an outbound-click test designed for website traffic.
In Ads Manager, save separate columns for CTR (all), CTR (link click-through rate), Outbound CTR, Landing page views, and conversion rate. Keep the date range and attribution settings consistent.
Document the exact column name in your reporting convention, and carry a matching metric-definition label through campaign naming and UTM metadata where useful. UTMs don't calculate Meta CTR, but consistent labels help analysts avoid joining unlike reports.
Benchmark CTR by Campaign Objective
For traffic campaigns, 1.71% is a useful reference, while roughly 1% warrants investigation, 1.5% to 2% is broadly competitive, and above 2% is strong if acquisition cost holds, according to Fibbler's summary of WordStream and LocaliQ's 2025 benchmarks. Its traffic sample covered 554 US campaigns running from April 2024 through June 2025, averaging $0.70 CPC, while lead-generation campaigns averaged 2.59% CTR.
At that traffic benchmark, 10,000 impressions would generate roughly 171 clicks. That's a planning estimate, not a promise about how a sales-optimized campaign should behave.
The reference points below also include a neutral benchmark summary, which gives typical traffic CTR of 0.5% to 1.5% and lead-generation CTR of 1% to 2%, and AgencyHandy's account of LocaliQ's 2024 figures, which reports 2.50% for Facebook Lead Ads.
Benchmark CTR by campaign objective
| Objective | Benchmark CTR | Source or basis | How to read it |
|---|---|---|---|
| Traffic, 2025 average | 1.71% | 554 US traffic campaigns, April 2024 to June 2025 | Above 2% is strong if acquisition cost holds |
| Traffic, typical range | 0.5% to 1.5% | Neutral benchmark summary | Below 1% needs investigation |
| Lead generation, 2025 average | 2.59% | Same 2025 benchmark report as the traffic average | Compare only with other lead campaigns |
| Lead Ads, 2024 average | 2.50% | LocaliQ 2024 Facebook Ads data | Older baseline, use as a sanity check |
| Lead generation, typical range | 1% to 2% | Neutral benchmark summary | Above 2% is strong if lead quality holds |
Why the objective changes the comparison
These published ranges don't establish one universal threshold. The neutral summary describes typical ranges, while the campaign dataset reports an average from a defined sample. Without matching measurement definitions and sample composition, the difference can't establish that one source is wrong.
Traffic and leads shouldn't share a target. Your selected optimization outcome changes which users Meta tries to reach, and an Instant Form creates a different journey from an external landing page. The distinction between campaign objectives matters before you rank creative performance.
For operating decisions, choose the objective row first, then compare each ad set against its own 14-day median link CTR. Treat that window as a working reporting convention, not a statistically guaranteed minimum.
Sales and conversion campaigns have no directly comparable CTR row here. Set their reference from their own recent delivery, then judge deviations only after checking cost per purchase.
Industry Benchmarks and Why One Number Misleads
A 4.13% link CTR can be ordinary in one vertical and unusually strong in another. In WordStream's 2025 benchmark analysis, Shopping, Collectibles and Gifts reached 4.13% link CTR, while Automotive Repair, Services and Parts recorded 0.80%, and Finance and Insurance 0.98%. The dataset covered 1,180 campaigns running from April 2024 through June 2025 and reported an overall cross-industry average; read that average as context for the sample, then judge an account against the closest category row.
Don't merge that campaign count with the US traffic-only sample. Matching headline averages don't make the underlying samples identical.
A separate Triple Whale benchmark compilation reports ecommerce category medians ranging from 1.98% for Food and Beverage to 3.02% for Health and Wellness; it also describes another methodology reporting an overall Meta average of 0.90%, ecommerce at 1.20%, SaaS at 0.75%, and legal services at 0.55%. Those figures can coexist because a category median, a platform-wide mean and a vertical average describe different slices of delivery.
CTR benchmarks by industry and ecommerce category
| Category | Benchmark CTR | Basis | Read as |
|---|---|---|---|
| Shopping, Collectibles and Gifts | 4.13% | WordStream 2025, 1,180 campaigns | Highest reported; assess purchase intent |
| Health and Wellness | 3.02% | Ecommerce median compilation | Highest ecommerce median |
| Travel | 2.76% | WordStream 2025, 1,180 campaigns | Strong |
| Sports and Recreation | 2.60% | WordStream 2025, 1,180 campaigns | Strong |
| Beauty | 2.46% | Ecommerce median compilation | Competitive |
| Apparel and Accessories | 2.44% | Ecommerce median compilation | Competitive |
| Home and Garden | 2.38% | Ecommerce median compilation | Competitive |
| Sports and Outdoors | 2.01% | Ecommerce median compilation | Around 2% |
| Food and Beverage | 1.98% | Ecommerce median compilation | Just under 2% |
| Finance and Insurance | 0.98% | WordStream 2025, 1,180 campaigns | Below 1%; check creative relevance |
| Physicians and Surgeons | 0.83% | WordStream 2025, 1,180 campaigns | Low; judge against own history |
| Automotive Repair, Services and Parts | 0.80% | WordStream 2025, 1,180 campaigns | Low; judge against own history |
The category isn't the whole explanation
Purchase intent, audience familiarity, offer strength and creative-message fit provide plausible explanations for category differences. The benchmark shows where rows land; it does not measure how much each factor contributed.
The spread is easier to see visually.
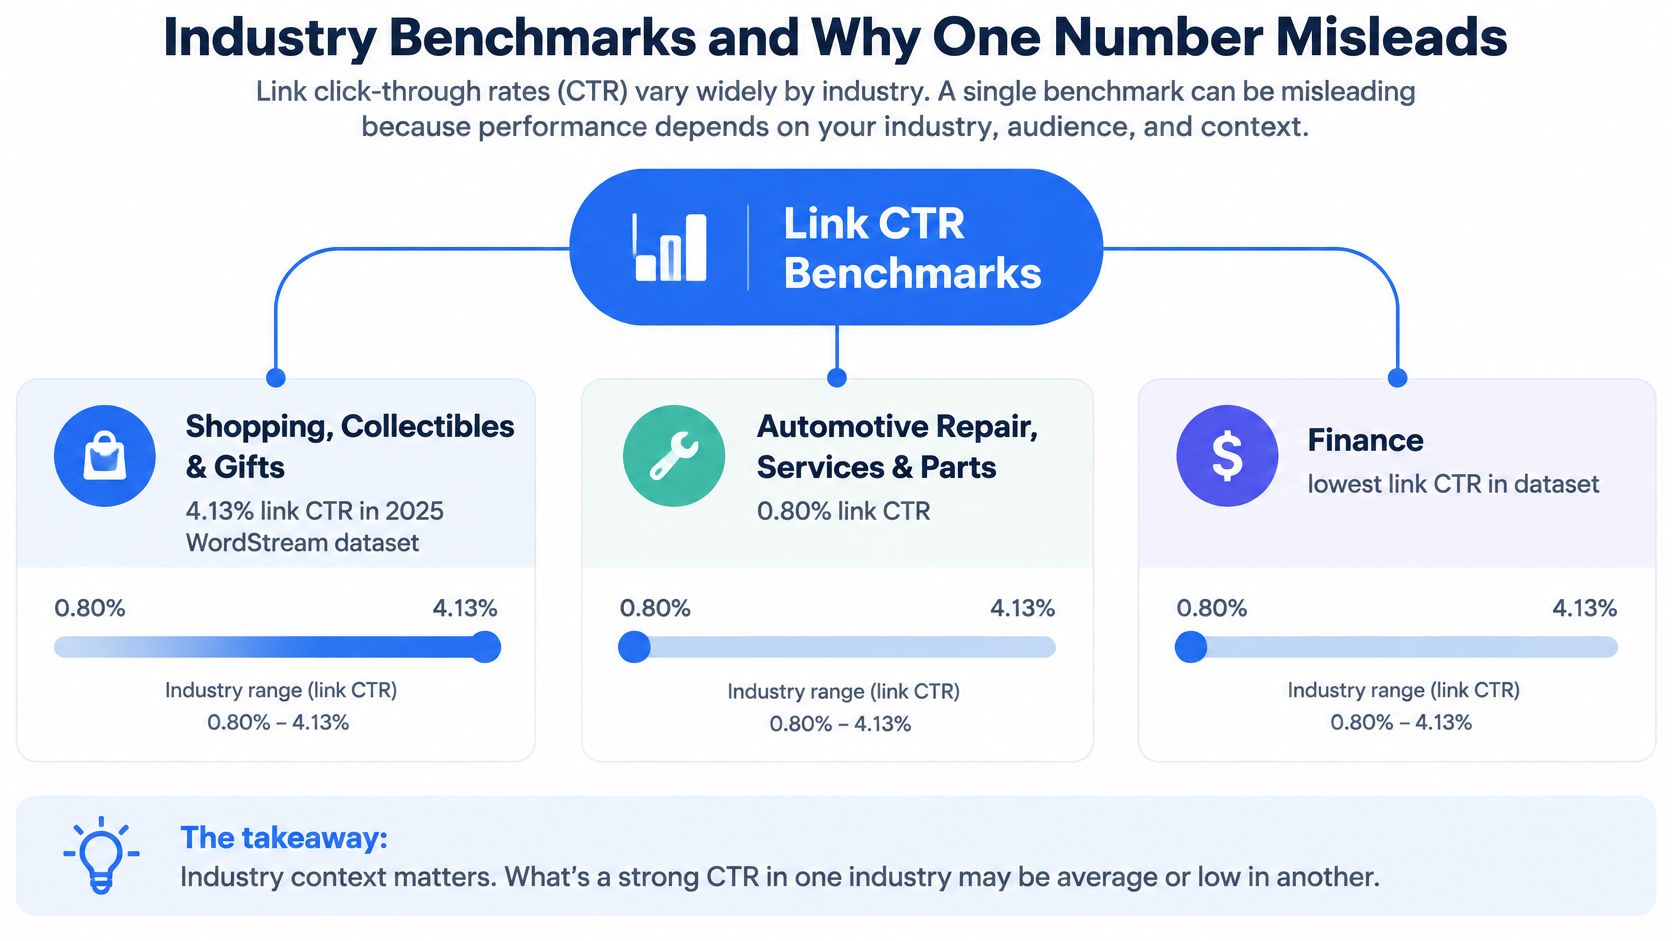
The financial-services result isn't the lowest row in the table. Automotive repair and physicians sit below it, an important distinction when interpreting simplified industry graphics.
Before using any row as a verdict, confirm whether the source counted all clicks or link clicks, reported a mean or median, and mixed objectives or geographic markets. A low-CTR account can still be healthy if it buys expensive, high-intent clicks efficiently; a high-CTR account can still fail if cheap clicks never turn into purchases.
An external benchmark can identify an unusual result. It can't establish why your account produced it.
Fix the click definition, select the relevant category, then locate each creative within your account's historical distribution. For large creative batches, that distribution is more actionable than forcing every ad to clear an industry-wide average.
Placement Benchmarks and When Low CTR Is Fine
In AdBacklog's 2025 benchmark comparison, Facebook Feed sits at approximately 1.1%, Stories at 0.8%, Reels at 0.6% to 1.0%, and Audience Network at 0.6%, while the dataset values compared alongside them read 1.11% versus 1.32% for Feed and 0.94% versus 2.14% for Reels.
Placement CTR benchmarks and the metric to check instead
| Placement | Compilation CTR | If published values differ | Check first |
|---|---|---|---|
| Facebook Feed | About 1.1% | 1.11% and 1.32% appear in different datasets | Outbound CPC and CPA |
| Facebook Stories | About 0.8% | Compare against your own account history | Landing-page view rate and frequency |
| Facebook Reels | 0.6% to 1.0% | 0.94% and 2.14% appear in different datasets | CPA and conversion rate carry more weight than click cost |
| Audience Network | About 0.6% | Compare against your own account history | CPA against Feed on the same objective |
A gap that wide turns placement CTR into an upstream signal. It can flag inventory worth reviewing; it cannot decide whether the inventory pays. Delivery mix, click definitions and reporting windows can move the same placement into a different band, so judge the economics behind the click before judging the click itself.
Test efficiency before excluding inventory
A lower-CTR placement can remain useful when cheaper impressions or stronger post-click conversion compensate for fewer clicks. A Reels click can also be cheap because the format rewards casual interaction, so a low CPC there still needs conversion evidence.
In Ads Manager, select Breakdown, then the placement breakdown, and retain the platform distinction. Compare within the same audience, objective and reporting window, and keep Facebook and Instagram surfaces separate enough that a blended label cannot hide the source of the result.
Use this decision sequence:
- Check outbound CPC: Establish what you paid for an actual off-platform click.
- Check landing-page view rate: Determine whether those clicks became loaded destinations.
- Check conversion rate and CPA: Keep placements that produce acceptable business outcomes, even when CTR looks weak.
- Check frequency: Separate repeated exposure from broader delivery.
Do not switch off a placement because its CTR falls below the account average. First determine whether it worsens the cost of acquiring the outcome you buy.
Keep the comparison controlled: hold the offer, message, audience and reporting window constant, then let placement explain the remaining difference. Placement-level naming and UTMs make that audit possible; without them, an aggregate result can conceal whether the placement is inefficient or receiving an unsuitable asset.
Factors That Move CTR and How to Diagnose Them
CTR symptoms, likely causes and first checks
| Symptom | Likely cause | First check |
|---|---|---|
| Low link CTR with normal CPM | Weak hook or creative-message mismatch | Compare the opening seconds and headline of the top three creatives |
| High CTR (all), low link CTR | Curiosity or engagement clicks | Compare the CTR (all) and link CTR gap per creative |
| High link CTR, low landing-page views | Post-click friction or slow page | Landing-page view rate and page load time |
| CTR falling over 7 to 14 days | Possible creative fatigue and rising frequency | Frequency trend, then refresh creatives |
| Low CTR in Stories and Reels only | Possible asset ratio mismatch | Test 9:16 assets in those placements |
| Strong CTR, weak CPA | Low-intent audience or offer | Conversion rate and cost per purchase by ad set |
Treat these as diagnostic hypotheses, not automatic verdicts. The time window and creative comparison count are practical review choices, not universal performance thresholds.
A weak hook can fail to communicate why the intended buyer should continue. An engagement-heavy ad can encourage comments without establishing interest in the offer, while a slow page can lose people after they've already clicked.
Change the variable connected to the symptom
Audience temperature, offer strength, frequency and format can all change the interpretation. Compare cold prospecting separately from warm retargeting, and don't attribute a change to the hook if the audience or placement mix changed simultaneously.
For a suspected hook problem, compare the opening frame, first spoken line, headline and CTA. Keep the offer stable while testing different ways to introduce it.
If producing video variants is the bottleneck, the ShortGenius Meta ad creator, an AI Video / AI Ad Generator from ShortGenius, is a resource to evaluate for that production task. Generated variations still need the same controlled delivery and downstream checks as manually produced assets.
Rapid Ads supports Flexible Ads, where Meta mixes the winning images and videos within the ad. Test a flexible batch against single-asset ads for the same audience before concluding that the underlying hook is weak.
Diagnostic discipline: Find the broken transition before replacing the creative. A click problem and a page-load problem need different interventions.
Keep ad performance metrics together in the review rather than distributing click and purchase reporting across disconnected dashboards. Otherwise, a buyer can approve a CTR winner before noticing that its acquisition economics deteriorated.
Change one variable per ad set and log the change date. Record edits to the audience, budget, creative and destination separately, so subsequent CTR movements have an identifiable context.
Reading CTR Against Conversion Rate in a Worked Example
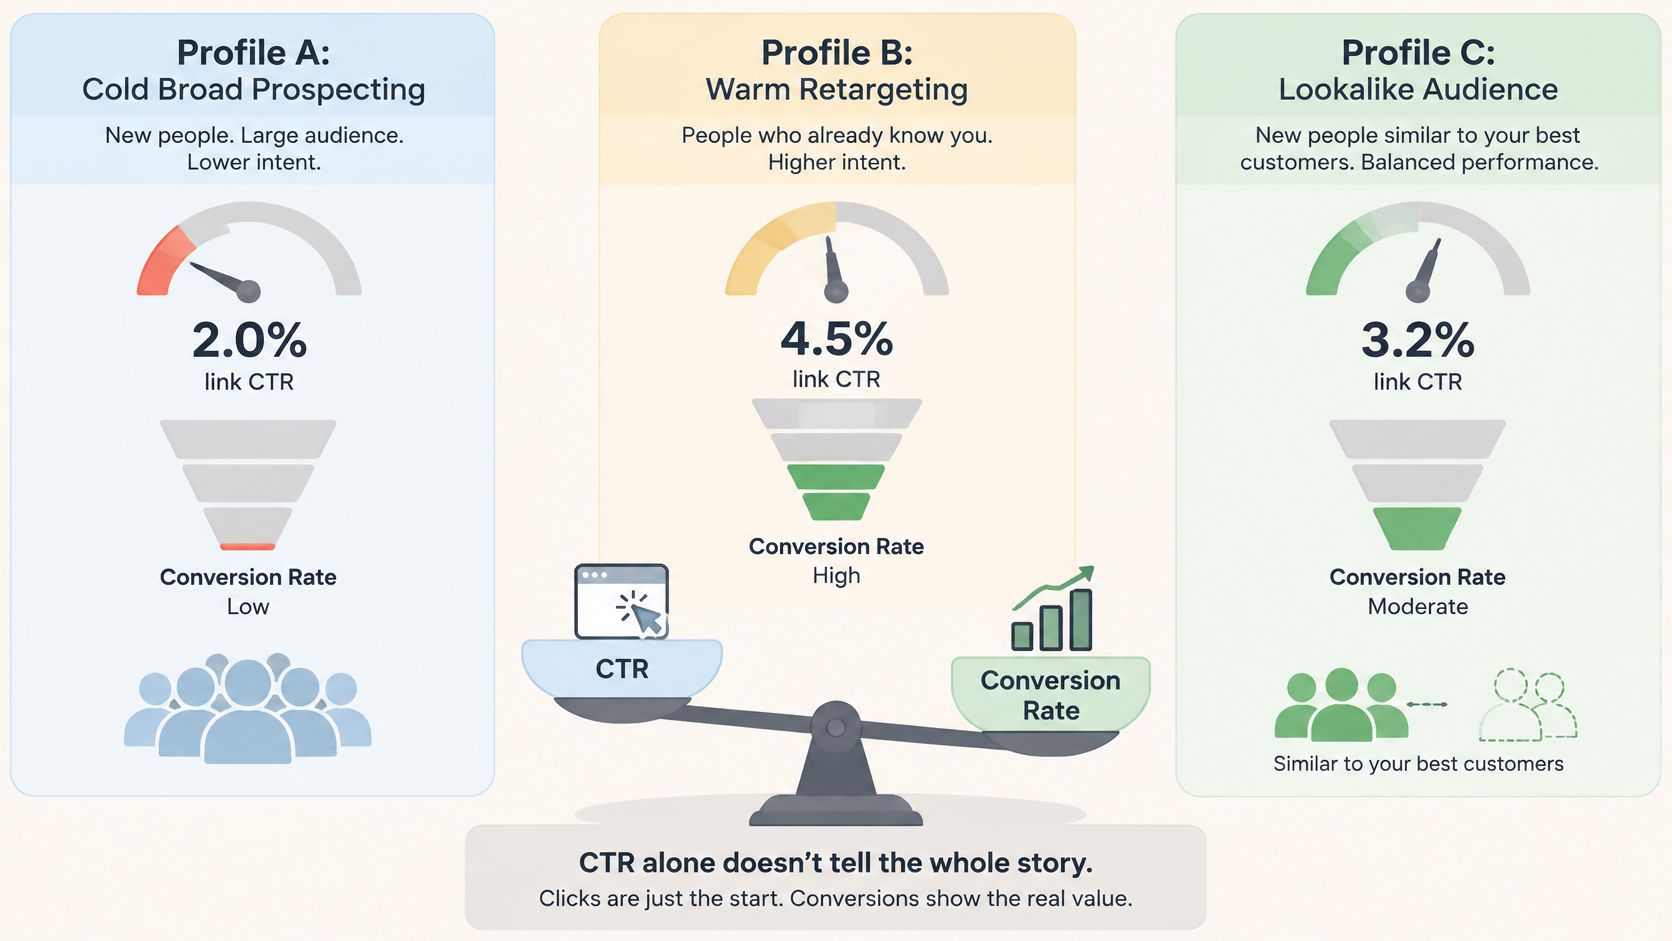
Consider three illustrative profiles, not observed campaign results. Their purpose is to show how a buyer could reach different decisions from CTR, destination quality and acquisition cost together.
The analytical premise is supported by SparkEighteen's discussion of campaign comparisons: a 2% link CTR in broad cold prospecting can be stronger than 4% in a small warm retargeting pool. Audience context changes what the apparent winner means.
Illustrative profile A merits scaling
A cold broad prospecting ad set records 2.0% link CTR, a landing-page view rate near 80%, and CPA on target. Those assumed values describe a coherent acquisition path: people click, most of those clicks reach a loaded page, and purchases meet the account's cost requirement.
Decision: scale, while monitoring marginal CPA as delivery expands. The justification isn't that CTR cleared an external benchmark; it's that the entire path currently meets the buying criteria.
The audience comparison below highlights why these profiles need separate interpretation.
Illustrative profile B needs a refresh
A small retargeting pool produces 4.0% link CTR, but frequency keeps climbing and CPA rises. That combination doesn't prove fatigue by itself, but it warrants checking saturation and the recency of the people still receiving ads.
Decision: refresh, rather than increasing spend because the click rate looks impressive. Review creative, audience recency and budget against the pool's capacity to produce additional purchases.
Illustrative profile C should stay live
A Stories placement records 0.8% CTR, low CPC and a strong conversion rate. If purchases remain within the account's acquisition target, the low click percentage isn't a reason to remove it.
Decision: keep. Here, the economic value comes from what the visitors do after clicking, not from maximizing the share of impressions that produce clicks.
Use the traffic benchmark as a planning reference only. Purchase CPA is spend divided by purchases, so validate Facebook conversion tracking before trusting the denominator. Without reliable purchase measurement, scale, refresh and keep decisions all rest on uncertain economics.
Set Your Own CTR Target Before You Scale
A useful target is an operating rule your team can apply consistently across accounts. It should specify the metric, comparison window and business outcome required before a creative receives more budget.
Use the visual as an overview of target-setting, then apply the more specific operating procedure below.
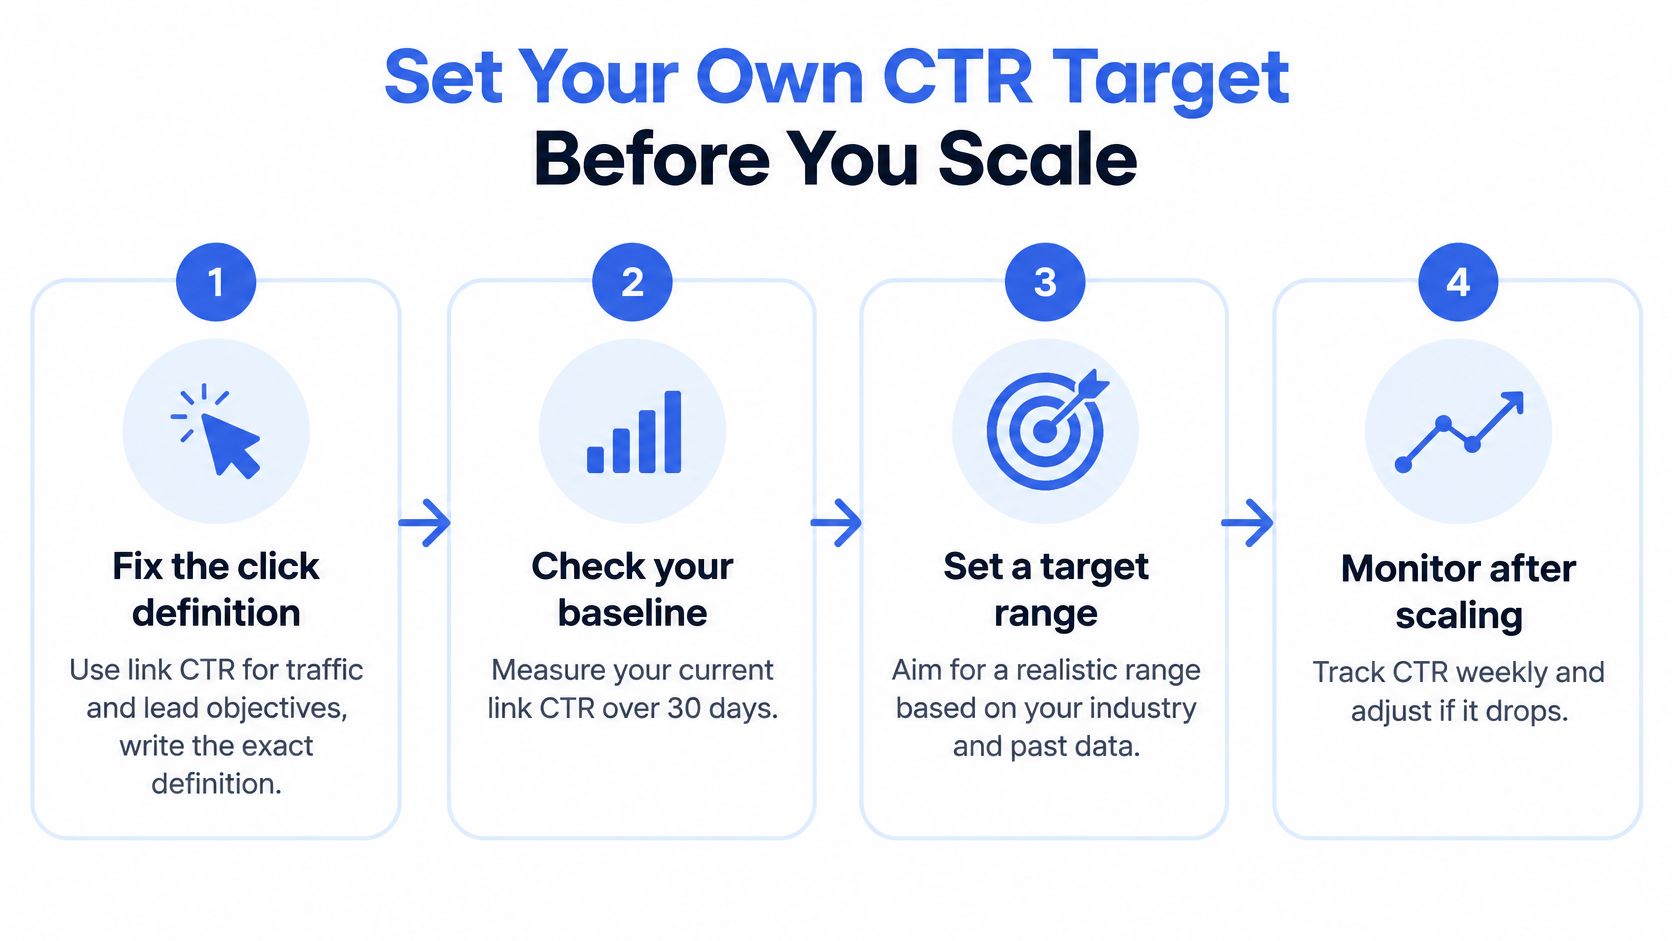
Fix the click definition. Use link CTR for traffic and lead objectives, with outbound CTR alongside it for website journeys, and document the exact Ads Manager column in naming and UTM conventions so analysts compare equivalent reports.
Choose the objective baseline. Select the relevant benchmark row, then calculate the ad set's median link CTR across the last 14 days of delivery as an internal working target, excluding inactive rows and keeping audience context consistent.
Separate placement and format. Judge Feed, Reels and Stories independently, because an aggregate improvement can reflect a change in delivery mix rather than a better creative.
Rank, then qualify. Rank creatives against that baseline, but confirm landing-page view rate, conversion rate and CPA before assigning more spend.
Scale only complete winners. Increase delivery for creatives that pass both the click and acquisition checks, and retire apparent CTR winners that continue to fail your CPA requirement after measurement is validated.
Use a scheduled fatigue review. As an internal review trigger, investigate creatives when CTR falls for two consecutive weeks while frequency rises, then refresh only after checking placement mix and conversion performance.
Make the workflow repeatable
Apply the convention to the whole batch, not a hand-picked sample. We can sort a dropped-in batch into ad sets with AI, then apply budgets, locations and ages, reducing repetitive launch configuration.
In one comparison, 100 creatives took 1h 57m by hand, while we launched the same ads in 8m 39s. That comparison measures launch time, not a CTR or CPA improvement; the performance benefit still depends on disciplined testing.
For a demonstration alongside your launch checklist, use the video below.
Rapid Ads offers bulk creative uploading, consistent ad and ad set naming, and multi-account launch management, helping you keep CTR comparisons organized as testing volume grows. Visit Rapid Ads to configure your next creative batch around a defined click metric, placement-specific tests and CPA-based scaling decisions.
