A TikTok view is counted each time a video starts playing inside an impression, and replays of that video within the same impression don't add another one. One person can hand a single post several views across separate sessions, so the headline figure measures how widely a video was served, not how many people watched it.
The most repeated advice in this space, that a big view number is proof a creative works, falls apart the moment you line it up against the retention rows in the same report. A video can collect 200,000 views and still lose four out of five viewers inside two seconds.
Media buyers running Meta at scale and testing TikTok alongside it need the opposite habit to the one most guides teach. Read views as a distribution volume figure, then read the threshold rows underneath it as the attention signal.
Table of Contents
- What a TikTok View Actually Counts
- How the For You Feed Decides Who Sees Your Video
- Common Misreadings of TikTok View Counts
- Views Compared With Watch Time, Reach and Impressions
- How Replays and Repeat Impressions Inflate View Totals
- Read Retention Rates Then Audit Before You Scale
What a TikTok View Actually Counts
TikTok's own video play definitions for advertisers settle the definition: a view is the number of times a video starts playing, counted separately for each impression, with replays excluded. Views are not unique viewers either. One person generates multiple views when the video reappears in a new impression, for example after swiping away and meeting it again later, but repeatedly replaying it inside that same impression adds nothing.
Everything else sits underneath that start count as a quality layer.
| Metric | Threshold | Replays counted | Use it to judge |
|---|---|---|---|
| Video views | Each play start within an impression | No | Distribution volume |
| 2-second views | At least 2 seconds of playback | No | Hook strength |
| 6-second views | At least 6 seconds, full playback if shorter, or one engagement in the first 6 seconds | No | Early retention |
| 25% video views | Plays reaching 25% of video length | No | Early drop-off |
| 50% video views | Plays reaching 50% of video length | No | Mid-video drop-off |
| 100% video views | Plays reaching the end of the video | No | Completion |
The gap between row one and row three is where most creative judgements go wrong. A video at 100,000 views can show a 6-second count at a fraction of that, and the gap is the honest measure of whether anyone stayed. None of those rows need a second opinion from a creative strategist. They need to be read side by side.
Two cases where the definition bites hardest. Under 6 seconds, the 6-second view equals completion, because full playback counts, so a short clip that looks like it retains brilliantly may be short. Above 6 seconds, the 6-second view becomes the more reliable early benchmark because it measures the same amount of attention regardless of runtime.
Working rule: total views are distribution volume. Every threshold row below it measures quality. Judge creative on the rows, allocate budget on the totals.
One more split to check before comparing any two posts: TikTok's business documentation separates paid views from organic ones. A boosted post and an organic post with the same view count are not the same result, and ranking them against each other before splitting by traffic source produces conclusions you can't defend.
How the For You Feed Decides Who Sees Your Video
A TikTok view count shows how much distribution a video received, not why the For You feed kept showing it. Two accounts can publish comparable videos and receive very different reach because recommendations respond to signals from viewers and content, not follower totals.
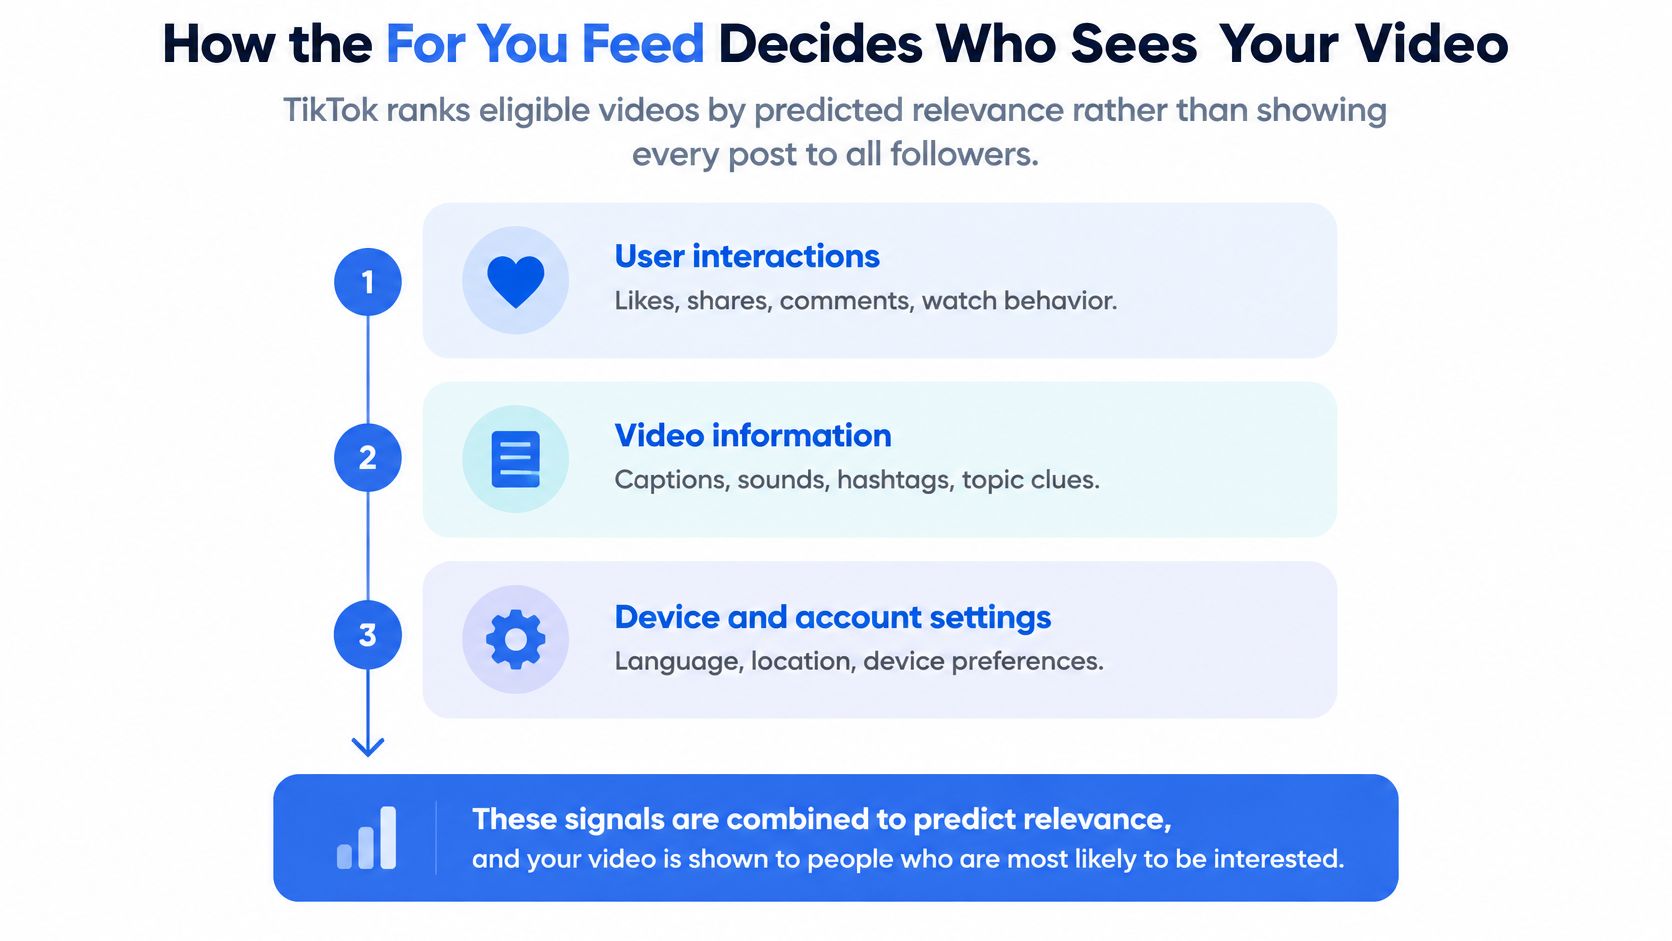
TikTok's recommendation system explanation groups its inputs into three categories. User interactions include likes, shares, comments, accounts followed, videos watched in full, videos skipped, and time spent watching. Content information includes sounds, hashtags, view counts, and the country where a video was published. User information includes viewer context such as language, location, and device.
These signals do not carry equal weight. TikTok says interactions, including watch time, are generally weighted more heavily for most users than the other categories, though factor importance can change. Its public explanations also describe signals such as watching, liking, sharing, commenting, searching, and marking content as not interesting, along with recency and regional popularity.
For a media buyer, that means distribution is an outcome, not a verdict on attention. A high view total shows that a video was served and played; the 2-second, 6-second, and completion rows help explain whether viewers stayed. Read those rows before attributing expanded distribution to the creative.
Consider two edits of the same 14-second energy drink ad. One opens with the product snapping open; the other starts with a three-second logo sting. If the first earns stronger early retention and more shares, those interactions may support further recommendations. If viewers skip the second quickly, its reach may stall. The example illustrates how different viewing responses can coincide with different distribution, not a guaranteed sequence or fixed test audience.
The first views are evidence to inspect, not a promise of expansion. For a practical overview of how to get TikTok views, compare distribution with the retention and engagement signals behind it. If a video's count remains near zero, start with account-level checks and this guide to fix low TikTok view counts.
Common Misreadings of TikTok View Counts
How do views work on TikTok is settled by the platform's own documentation. What circulates around it is less reliable, and three misreadings do the most damage to media buying decisions.
The fixed seed audience and the completion threshold. A widely shared explanation claims TikTok first shows every post to a predictable batch of 200 to 500 people, then applies a fixed completion-rate cut-off before deciding whether to widen distribution. Explainers repeat those figures as if they were platform rules, and the creator guide that popularises the claim doesn't source them to TikTok. Nothing in TikTok's own recommendation explanation describes a fixed initial batch or a published threshold, and treating either as a setting you can hit leads to the wrong conclusion when a video underperforms.
Follower count and past hits as reach drivers. TikTok's explanation names interaction and content signals as the inputs, and states that follower count and prior high-performing posts are not direct recommendation factors. That contradicts the instinct to attribute a flat post to a small following or a strong one to momentum from last month's winner.
View velocity as a diagnosis. Watch time and video views are separate concepts in TikTok's ad reporting, which makes raw view speed an incomplete read. A post can accelerate and still be losing people at two seconds.
The useful question isn't whether the algorithm buried the video. It's whether the video failed because its early sample was tiny, or because it was shown to people who had no reason to care.
Answer it by comparing retention and engagement by traffic source and audience segment instead of by post. If paid traffic holds a 6-second rate that organic doesn't, the creative is fine and the audience match isn't. Then iterate on the first two seconds, on topic clarity, and on who the ad set reaches.
Localisation matters here as well. Language, location and device context feed the ranking signals, so duplicating a winning creative across markets doesn't guarantee equivalent reach. A spot that lands in one country can be served to a colder, mismatched audience in another.
Views Compared With Watch Time, Reach and Impressions
Four delivery metrics share a dashboard and get used interchangeably. They answer different questions, and each one has a specific failure mode.
| Metric | What it counts | Good for | Misleads when |
|---|---|---|---|
| Views | Play starts with replays excluded | Scale of starts | Loops and repeat impressions inflate the total |
| Watch time | Total or average seconds watched | Attention depth | Longer videos score higher by default |
| Reach | Unique accounts exposed | Audience breadth | Says nothing about how long people watched |
| Impressions | Times content was displayed | Delivery volume | Display without a play overstates exposure |
Views are the cheapest metric to move and the least informative on their own. A loop-heavy clip can pile up starts from a small audience, which is why a variant that leads on views and trails on everything else is a flag rather than a winner.
Watch time rewards length. A 45-second explainer will beat a 12-second hook on total seconds watched even when the short one holds attention better. Compare average watch time as a share of runtime, or compare variants of similar length.
Reach tells you how many distinct accounts saw the creative and nothing about what they did with it. Two campaigns at identical reach can differ by a factor of five in completion.
Impressions count displays, including cases where the content appeared without a play starting. That makes impressions useful for delivery pacing and useless for judging creative quality.
The combination is what carries an argument. Use reach for breadth, impressions for delivery volume, views for start volume, and average watch time plus the 6-second row for attention depth. Then run the check that catches most bad calls: rank each creative variant on views, average watch time and reach side by side, within the same traffic source, before declaring a winner. A variant first on views and last on average watch time isn't your best asset. It's a distribution puzzle to diagnose.
How Replays and Repeat Impressions Inflate View Totals
Repeat exposure is the main reason a view count outruns the audience behind it. A video that reappears in a fresh impression counts again, even when the same person is on the other side of the screen.
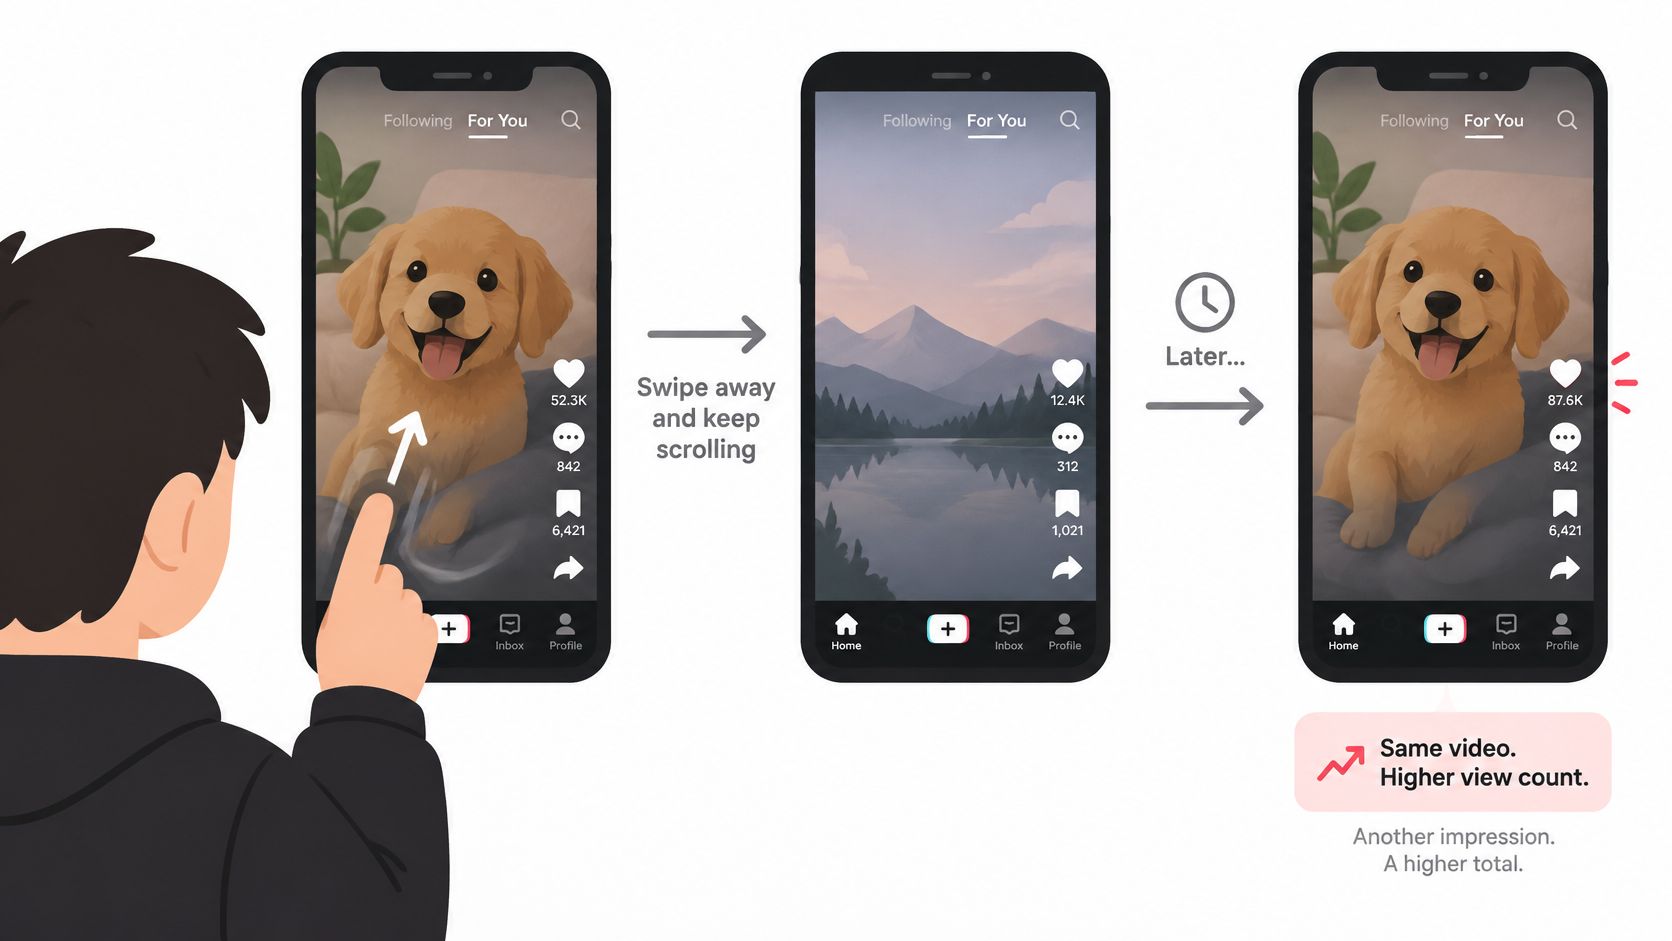
Run the arithmetic on a real shape of report. A 12-second clip logs 50,000 total views. If 10,000 accounts each met it twice across separate sessions, that accounts for 20,000 of the 50,000 from only 10,000 people. The remaining 30,000 may be new viewers, or may be a third and fourth pass at the same pool. The total can't tell you which.
TikTok reports completion thresholds separately from total views, including 25%, 50% and 100% video views, per its supported metrics documentation for audience reporting. Each threshold counts the times the video reached at least that proportion of its length during an impression, and replays are excluded. Comparing those three rates against total starts locates the problem: an immediate loss, a mid-edit loss, or a loss at the final call to action.
Short videos distort the headline fastest. A six-second loop that autoplays can stack up starts in seconds because every restart that follows a swipe counts as a fresh impression. The 100% row, not the total, tells you whether anyone watched the loop through.
Two patterns look identical in the totals and mean opposite things. Views climbing while average watch time and the 6-second rate fall means repeat exposure. Views climbing while average watch time holds steady means new viewers, and that's the only version worth scaling.
The three-step check for inflated totals
- Pull views, reach where it's reported, average watch time, 2-second views and 6-second views for the same post and the same date range.
- Divide views by 6-second views to get an exposure ratio. Treat a sudden jump in that ratio as a signal to look closer, not as growth.
- Check whether average watch time moved with the view count. If views rose and watch time didn't, the extra starts came from people who didn't stay.
Read Retention Rates Then Audit Before You Scale
Retention is the part of the report that survives scrutiny, so it needs a fixed reading order rather than a glance at the biggest number.
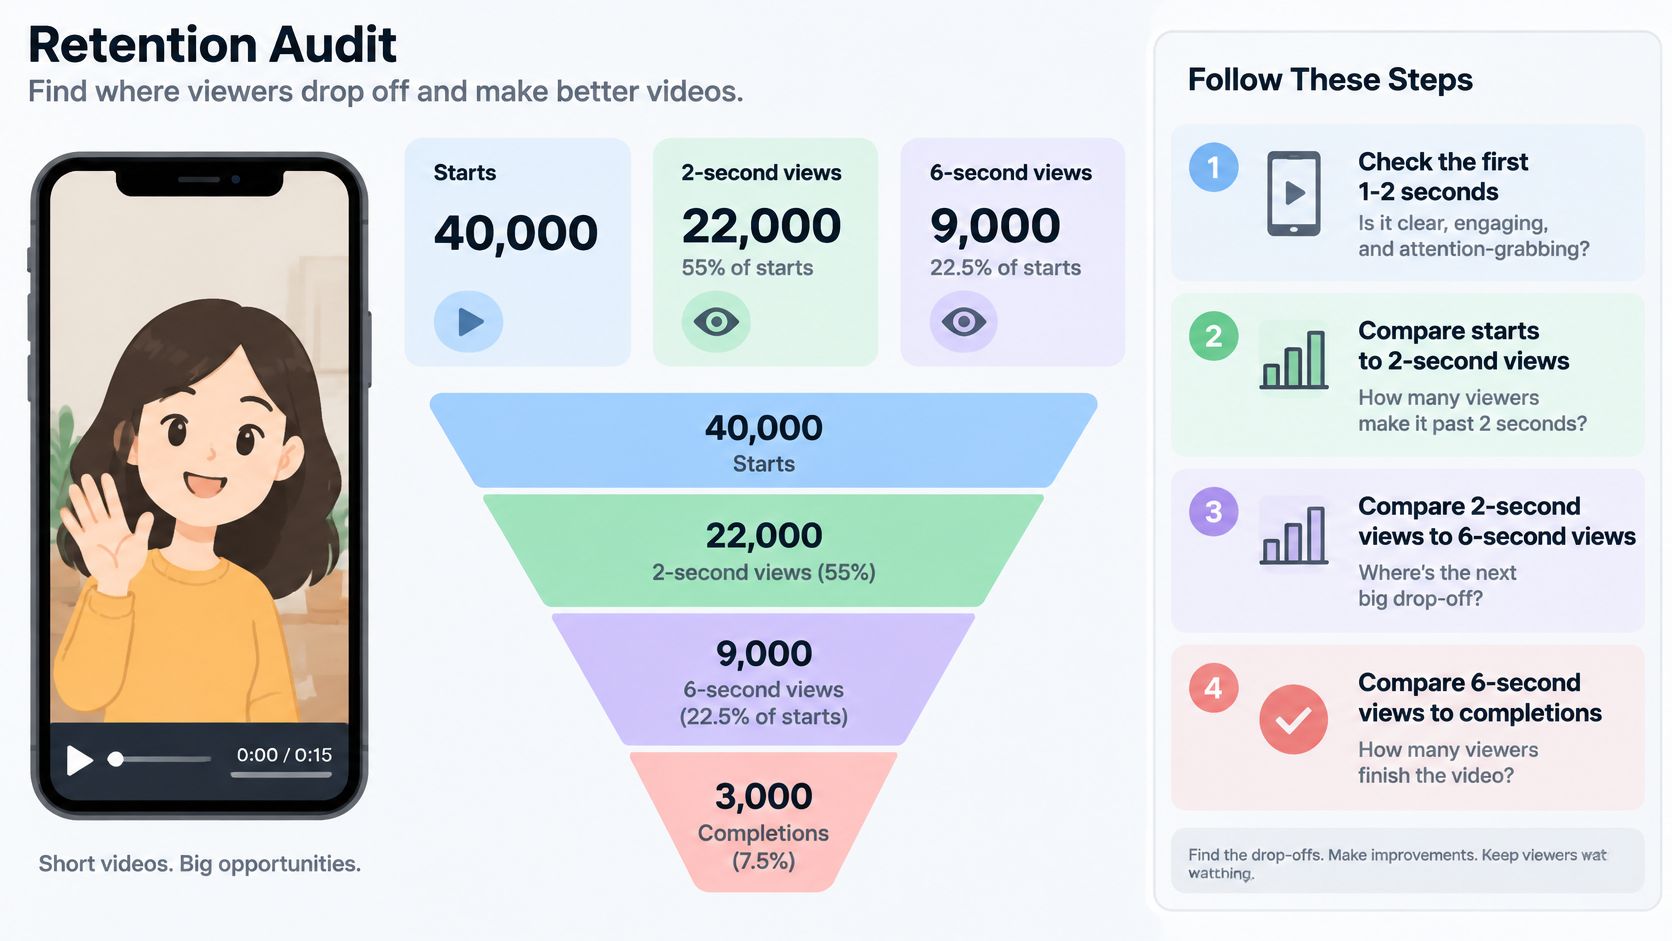
Take a creative that reports 40,000 starts, 22,000 2-second views, 9,000 6-second views and 3,000 completions. That's 55% at two seconds, 22.5% of starts at six seconds, and 7.5% completing. The first number says the opening works. The second says the promise made in that opening isn't being paid off fast enough. The third says the ending sheds people who stayed that far.
TikTok's analytics product guidance makes the measurement concrete. A 6-second focused view requires at least six seconds of playback, full playback for videos under six seconds, or an engagement inside the first six seconds, and completion rate is complete views divided by total views. Because the 6-second threshold ignores runtime once a video passes six seconds, it compares a 10-second hook against a 40-second explainer fairly.
The sequence that produces a decision rather than a debate:
- Watch the first two seconds. Nothing in the numbers fixes a hook that doesn't communicate.
- Compare total starts with 2-second views. This is the drop that happens before your point lands.
- Compare 6-second views with 2-second views. This is the drop between interest and payoff.
- Place the next loss using the 25%, 50% and 100% rows.
- Check average watch time and rewatches against the previous posting cycle.
The drop-off map
| Pattern | Likely cause | Where to fix |
|---|---|---|
| High total views, low 2-second rate | Opening fails to hold attention | First 1-2 seconds |
| Strong 2-second rate, weak 6-second rate | Early promise not delivered | Payoff timing and topic clarity |
| Strong 25% rate, sharp 50% drop | Sagging middle section | Pacing in the middle third |
| Good 50% rate, weak 100% rate | Loss near the ending | Final seconds and call to action |
| Views rising, average watch time flat | Repeat plays or the wrong audience | Audience fit and traffic source split |
Fix the opening when the 2-second rate is the weakest row. Lead with the outcome or the problem, not the setup, and cut the first frame to whatever the viewer gets.
Fix the payoff when two seconds hold but six don't. The first frame made a promise the middle didn't keep, usually because the useful part arrives after the viewer has already decided.
Fix the middle when the 25% row is strong and the 50% row collapses. That's pacing, not concept, and a tighter edit of the same footage often solves it.
Fix the ending when 50% holds and 100% doesn't. The final seconds carry the call to action, and that's the part people leave for.
Views climbing against flat average watch time is the one pattern the creative can't fix. Treat it as an audience and traffic-source problem before you touch the edit.
Audit before spend
Split paid and organic by traffic source first, then pull views, 2-second, 6-second, completion and average watch time for each variant. Flag any ad where views rose while the 6-second rate fell, re-test the opening on a fresh batch, and scale only when retention holds across two separate audience segments.
None of that is possible if you can't tell variants apart in reporting. Rapid Ads bulk-uploads the batch and enforces a naming convention at ad and ad set level, which is how one comparison took 100 creatives from 1h 57m by hand to 8m 39s, with 100 ads live in under 10 minutes. Clean names are what let you sort a report by hook version and read the 6-second column without guessing. For teams amplifying creator content, Clipatra's explanation of verified view counting covers how view figures are validated on the partner side, and our own guide to how to see views on TikTok shows where each of these rows sits in the interface.
Rapid Ads gives media buyers a way to launch creative variants with names that stay consistent, so the 2-second and 6-second columns are readable the moment the test goes live. Upload a batch in bulk, apply your naming convention once, lock the Advantage+ enhancements you want, and publish hundreds of ads without rebuilding each one by hand. You can try it on the free plan and see how it fits your next test round at Rapid Ads.