The request usually lands the same way. A client, founder, or finance lead asks for a budget number by end of day. Not a range they can discuss. A number they can drop into a spreadsheet and defend in a meeting. They want to know what Meta will cost next month, in one market or five, across prospecting and retargeting, with enough confidence to approve spend.
That's where most Facebook ad cost estimator conversations go wrong. Teams treat the estimator like a quote generator when it's really a planning model for an auction. Meta pricing isn't fixed. It's auction-driven, shaped by competition, ad relevance, and estimated action rate, so any estimate is only as good as the assumptions behind it. One 2026 calculator guide on Facebook advertising cost planning makes that point clearly and notes benchmark references such as average CPC around $0.51 and average CPM around $8.77, while also stressing that CPM often sits in a broader $5 to $15 range and can move higher in competitive sectors.
Experienced buyers already know the problem. The hard part isn't filling in a calculator. The hard part is deciding what assumptions are defensible before launch, what range to present to stakeholders, and how quickly to tighten that range once real delivery starts coming in.
Table of Contents
- Beyond the Black Box of Facebook Ad Costs
- Deconstructing the Ad Cost Formula
- What Do Facebook Ads Really Cost in 2026
- How to Build a Practical Cost Forecasting Model
- From Forecast to Reality How to Lower Your Ad Costs
- Scale Your Ad Testing and Outpace the Auction
Beyond the Black Box of Facebook Ad Costs
A senior buyer rarely gets in trouble for being slightly wrong on a forecast. They get in trouble for sounding certain when they shouldn't.
That's why a useful Facebook ad cost estimator isn't a one-cell calculator that spits out one answer. It's a structured way to say, “If CPM lands here, if CTR holds here, and if the landing page converts here, this is the range we should expect.” That sounds less polished than a single number, but it's far more useful once spend goes live.
The real job of the estimator
Most stakeholders ask for cost. What they need is decision support.
A practical estimator helps you answer questions like:
- Budget sufficiency: Can this campaign gather enough signal before anyone judges it too early?
- Scenario risk: What happens if auction pressure pushes CPM to the top end of your expected band?
- Scaling readiness: If CTR improves, does the model support budget expansion without blowing up CPA?
- Market comparison: Does the same creative concept still make sense across different geos or placements?
Practical rule: If your estimate has one output and no range, it's a budget guess, not a forecasting model.
What experienced teams do differently
Good teams don't ask, “What will Facebook cost?” They ask, “What assumptions are carrying the forecast?”
That changes the conversation fast. Instead of debating whether a projected CPA is “realistic,” you can isolate the pressure points. Maybe CPM is reasonable but your CTR assumption is too optimistic for broad prospecting. Maybe the traffic estimate is fine, but the post-click conversion assumption belongs to branded search, not cold paid social.
The estimator becomes operational once it does three things well:
| Use case | Weak estimator | Strong estimator |
|---|---|---|
| Client planning | One fixed number | Best, base, and worst case range |
| Media setup | Budget only | Budget tied to CPM, CTR, CVR assumptions |
| Optimization | Static pre-launch tool | Updated after early delivery data |
| Scaling | Generic benchmarks | Account-specific assumptions once data arrives |
The point isn't to predict Meta perfectly. The point is to enter launch week with a model that's honest about uncertainty and useful enough to guide action.
Deconstructing the Ad Cost Formula
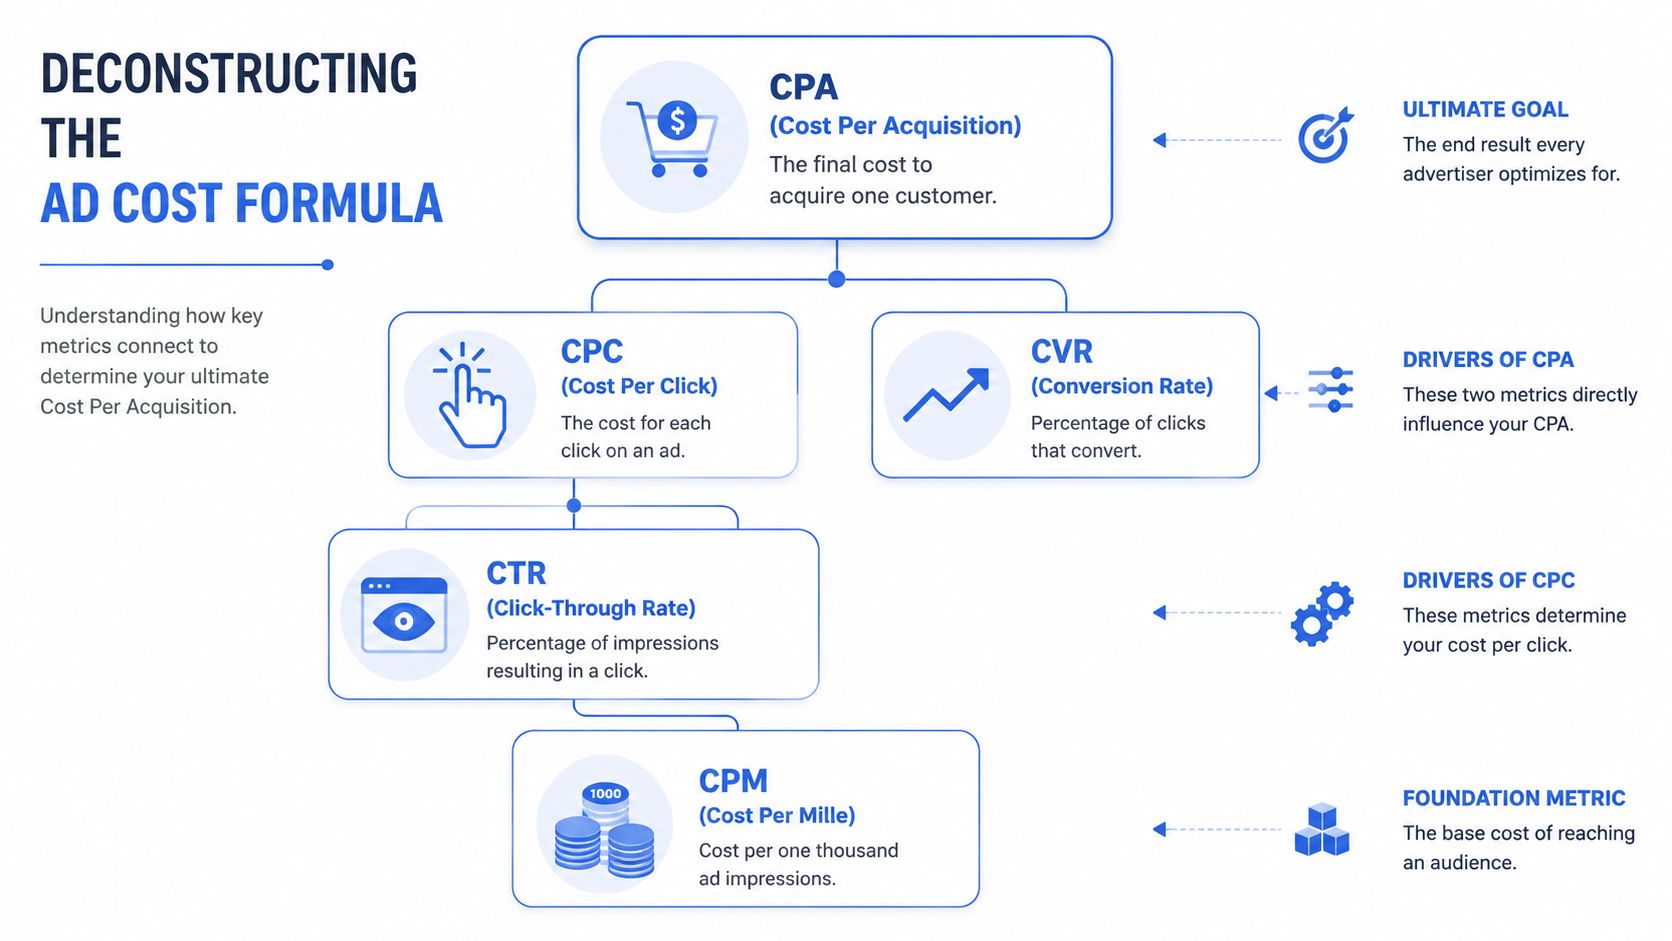
Every estimator worth using sits on the same core math. The formulas aren't complicated. The discipline comes from how you chain them together.
The standard definitions are straightforward. CPC = total spend divided by clicks, CPM = (total spend / impressions) × 1,000, and CTR = clicks divided by impressions × 100, as outlined in Coefficient's Facebook ads cost calculator guide. Those metrics became the foundation for forecasting because they let buyers compare campaigns and model outcomes with a common language.
The waterfall model buyers actually use
In practice, buyers don't start with CPA. They build down to it.
A simple waterfall forecast usually works like this:
- Start with total budget
- Assume a CPM
- Convert budget into projected impressions
- Assume a CTR
- Convert impressions into projected clicks
- Assume a conversion rate
- Convert clicks into projected conversions
- Divide spend by conversions to estimate CPA
That sequence matters because it forces you to show where the model is fragile. If the forecast depends on a strong CTR to make the economics work, everyone should know that before launch.
Why small input changes break forecasts
Most bad forecasts don't fail because the math is wrong. They fail because one input was borrowed from the wrong context.
A common example is CTR. If you model prospecting with a CTR assumption taken from your strongest retargeting ads, the forecast will look clean and collapse the moment spend starts.
Here's the operational point: CTR changes traffic volume, and traffic volume changes everything downstream. A modest shift in expected engagement can reshape projected CPC, conversion count, and CPA.
A forecast should make the dependency obvious. If CTR softens, the whole model should show the damage immediately.
How the metrics interact
The easiest way to explain the system to a junior buyer is to show which metrics are upstream and downstream:
| Metric | Formula | What it influences next |
|---|---|---|
| CPM | (Spend / Impressions) × 1,000 | Reach and impression volume |
| CTR | (Clicks / Impressions) × 100 | Click volume from those impressions |
| CPC | Spend / Clicks | Traffic efficiency |
| CPA | Spend / Conversions | Acquisition efficiency |
That's why a Facebook ad cost estimator should never be built around budget alone. Budget is just the top line. Delivery efficiency depends on how CPM, CTR, and conversion rate behave together.
What works and what doesn't
What works:
- Use account history first. If the account has prior campaign data by market, objective, and placement, that should anchor the model.
- Model by funnel stage. Cold prospecting and retargeting should not share assumptions.
- Stress-test the inputs. Try weaker CTR, weaker conversion rate, and less favorable placement mix before approving budget.
What doesn't:
- Using a single blended average across all campaigns and calling it “expected performance”
- Treating CPC as the main input when CPM and CTR often explain more about what's happening
- Ignoring creative dependency when the entire estimate hinges on ad quality
Once you see the estimator as a waterfall instead of a widget, it becomes much easier to explain why forecasts vary so much between accounts that spend similar budgets.
What Do Facebook Ads Really Cost in 2026
A team approves a test budget on Monday, expects a clean $1 CPC based on a public benchmark, and by Friday the account is buying traffic at a much higher price in one ad set and a much lower price in another. That gap is normal. The mistake is treating a benchmark as the forecast instead of the starting assumption.
For 2026, the practical answer is a range, not a single number. Public benchmark roundups are still useful for early planning, and earlier references in this article point to commonly cited CPM and CPC bands for Meta campaigns. Use those numbers to frame the first draft only. The operational job is to convert that broad range into a best-case, base-case, and worst-case model your team can pressure-test before launch.
Cost estimates work better as scenario planning
A single average hides the part that matters most: uncertainty.
The same account can see very different costs based on audience temperature, creative quality, placement mix, seasonality, and how quickly the system finds conversion signal. That is why I prefer to forecast with three scenarios instead of one “expected” number. It gives the team a realistic spend plan and a faster read on whether results are tracking to plan or drifting off it.
| Scenario | How to use it | What assumptions belong here |
|---|---|---|
| Best case | Sets upside potential | Lower CPM, stronger CTR, stronger conversion rate, faster learning |
| Base case | Drives the working budget | Recent account averages adjusted for current market conditions |
| Worst case | Protects cash and expectations | Higher CPM, weaker CTR, slower conversion rate, delayed optimization |
This is the version a finance lead can review without getting misled by false precision. It also helps a buyer decide how much room the test needs before performance is judged.
Benchmarks still have a place
Use external benchmarks in a few specific situations:
- New account launches with little or no historical data
- New geographies where prior costs are not a clean match
- Budget planning conversations where stakeholders want a market reference before test data exists
Once spend starts flowing, benchmark data should lose influence quickly. Account history by objective, audience, and placement is more useful than any public average.
The cleanest planning stack looks like this:
| Priority | Data source | Best use |
|---|---|---|
| First | Your own account history | Forecasting spend and efficiency by campaign type |
| Second | Recent tests in similar conditions | Adjusting for seasonality, offer changes, and creative shifts |
| Third | Public benchmark ranges | Sanity-checking greenfield assumptions |
Benchmarks help start a forecast. Scenario modeling helps manage one.
A benchmark table you can use
Published benchmark tables often imply more certainty than they deserve, especially on CPA. CPM and CPC are easier to frame in ranges. CPA is where execution differences show up hard.
2026 Facebook Ad Cost Planning Ranges by Objective
| Campaign Objective | CPM expectation | CPC expectation | CPA expectation |
|---|---|---|---|
| Traffic | Usually modeled as a range, then refined with account data | Usually modeled as a range, then refined with click quality data | Rarely stable enough to use as a public benchmark |
| Lead Generation | Sensitive to audience quality and placement mix | Sensitive to form friction and creative-to-offer match | Moves heavily based on lead quality standards and form design |
| Conversions | Often fluctuates with competition, purchase intent, and season | Often changes with CTR and landing page alignment | Best estimated from your own conversion rate assumptions, not market averages |
That format is less polished than a table full of exact figures. It is more useful for real planning.
Why costs swing so hard inside the same account
Auction pressure matters, but execution usually explains more than teams expect. A stronger ad can hold CTR higher and offset a rising CPM. A weak landing page can erase that gain and push CPA well above plan even if click costs stay reasonable.
The estimator becomes a strategic tool. If the worst-case model breaks your allowable CPA, the answer is not to hope the base case shows up. The answer is to tighten the test design so you learn faster.
Practical examples:
- Launch enough creative variation to test the CTR assumption early
- Split prospecting and retargeting so blended results do not hide the problem
- Check landing page conversion behavior in the first days, not after the budget is mostly spent
- Replace weak assumptions with live account data as soon as results stabilize
That speed matters. The faster the team validates or rejects the estimate, the less budget gets wasted defending an assumption that was wrong.
How to Build a Practical Cost Forecasting Model
A useful forecast holds up in a Monday pacing call, a finance review, and the first 72 hours of live spend.
That standard rules out a lot of pretty spreadsheets.
The model needs to answer three operational questions fast. What is the expected cost if conditions are normal. What happens if the auction gets expensive or the landing page underperforms. How quickly can the team collect enough evidence to replace assumptions with live inputs. If the sheet cannot do that, it is reporting theater.
Set up the model around assumptions, not outputs
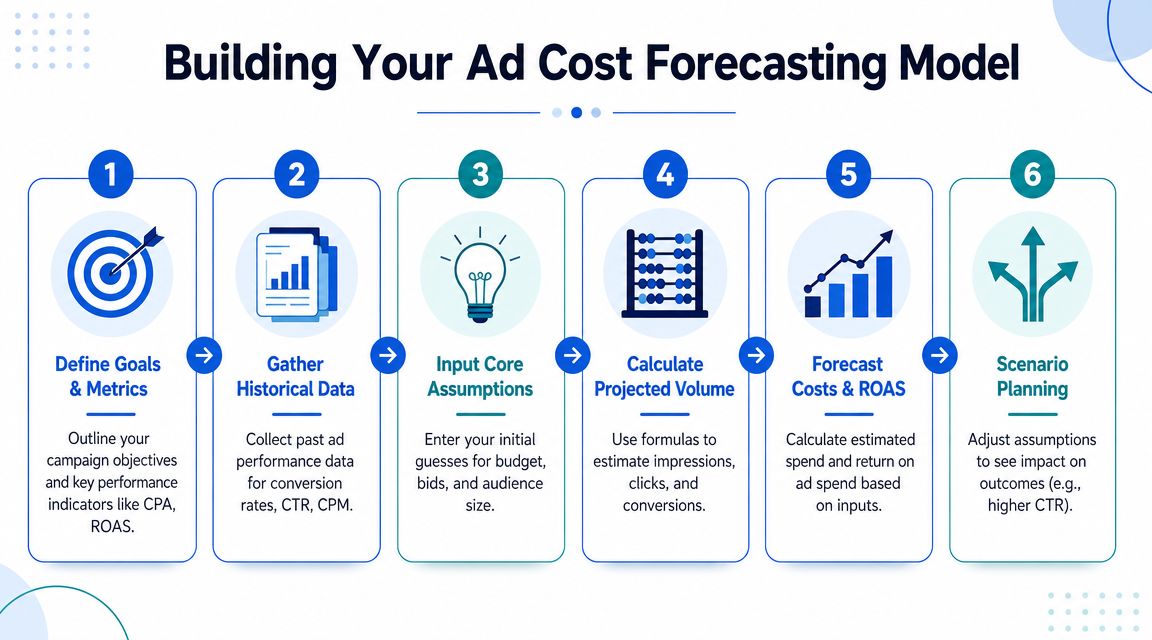
Build the sheet so a buyer can change one input and immediately see what breaks. Separate inputs, scenario assumptions, and outputs into distinct sections. Keep formulas visible. Protect only the cells that should never change.
Start with a compact input block:
- Total budget
- Campaign duration
- Objective
- Primary market
- Target AOV or lead value
- Scenario CPM
- Scenario CTR
- Scenario conversion rate
Then run the math in the same order the campaign works in real life:
| Step | Spreadsheet logic |
|---|---|
| Projected impressions | Budget ÷ CPM × 1,000 |
| Projected clicks | Impressions × CTR |
| Projected CPC | Budget ÷ clicks |
| Projected conversions | Clicks × conversion rate |
| Projected CPA | Budget ÷ conversions |
| Projected revenue | Conversions × AOV or lead value |
| Projected ROAS | Revenue ÷ spend |
That sequence matters. It forces the team to see whether the problem sits in traffic cost, click generation, or post-click conversion. It also makes debugging easier once spend starts coming in.
If you run multiple countries, audience types, or placement mixes, split them into separate assumption blocks. A single blended tab hides the reason a forecast missed. The roll-up belongs in the summary tab, not in the working model.
A short walkthrough helps if you want to see how teams structure this in practice:
Build best, base, and worst case scenarios
One forecast column is not enough for planning. Media buying decisions improve when the model shows a range and ties each range to an action.
Use three scenario columns:
| Scenario | CPM assumption | CTR assumption | Conversion rate assumption |
|---|---|---|---|
| Best case | Low end of a believable range | Strong, based on prior launches | Strong, but still realistic |
| Base case | Most likely launch condition | Expected engagement | Expected post-click performance |
| Worst case | Higher auction pressure | Softer engagement | Lower conversion efficiency |
The discipline is in the word believable. Best case should reflect results your account has approached before. Worst case should be painful, but still common enough that nobody is shocked if it happens.
I usually set the base case as the version I would defend to finance. The worst case decides whether the test earns a green light. If the downside case burns too much budget before you can learn anything useful, the launch plan is wrong even if the upside looks attractive.
Use the model to speed up validation
The estimator earns its keep after launch, not before it.
A practical model tells you how much budget and time you need to validate each assumption. If CTR is the biggest unknown, the first test should be built to read creative signal quickly. If conversion rate is the bigger risk, the plan should prioritize cleaner post-click data instead of stuffing more ads into the first week.
Ask questions that change how the test is structured:
- How much spend is needed before the CTR assumption is directionally clear?
- If CTR lands near worst case, do we still drive enough clicks to judge the offer or page?
- If CPM comes in high, which audiences or placements can be isolated before the blended CPA gets misread?
- What is the earliest point where live conversion data is reliable enough to overwrite the estimate?
Those questions turn the estimator into a planning tool. You are not trying to predict the exact CPA on day one. You are deciding how to learn fast enough that the wrong assumption does not stay in the budget for two weeks.
Pressure-test the model before spend starts
Run a few operational checks before launch.
If a higher CPM still produces an acceptable CPA because conversion rate is strong, the campaign can tolerate auction pressure. If a modest CTR miss destroys the model, creative testing needs more options on day one. If the forecast only works when every assumption lands at the high end, that is not a forecast. It is a hope case.
This review also exposes where the account needs tighter segmentation. Prospecting and retargeting should rarely share one assumption set. New-market launches should not inherit mature-market conversion rates without adjustment. Lead gen campaigns with stricter qualification logic need their own model because cheap lead volume can hide an expensive sales outcome.
Revise the forecast as soon as the account gives you a signal
The first version of the model is a planning document. The second version should be an operating document.
Update assumptions as soon as the account produces directional evidence by segment. Do not wait for perfect certainty. Waiting usually costs more than an early revision, especially when one input is clearly off.
The first updates usually come from:
- CPM landing outside your expected band
- CTR separating strong creatives from weak ones
- Placement mix changing the effective CPC
- Conversion rate splitting by audience or market
- Fatigue showing up earlier than planned
Once those inputs are replaced with live numbers, the estimator gets more useful. It stops being a static calculator and starts helping the team decide where to keep spending, where to cut, and which test should run next.
From Forecast to Reality How to Lower Your Ad Costs
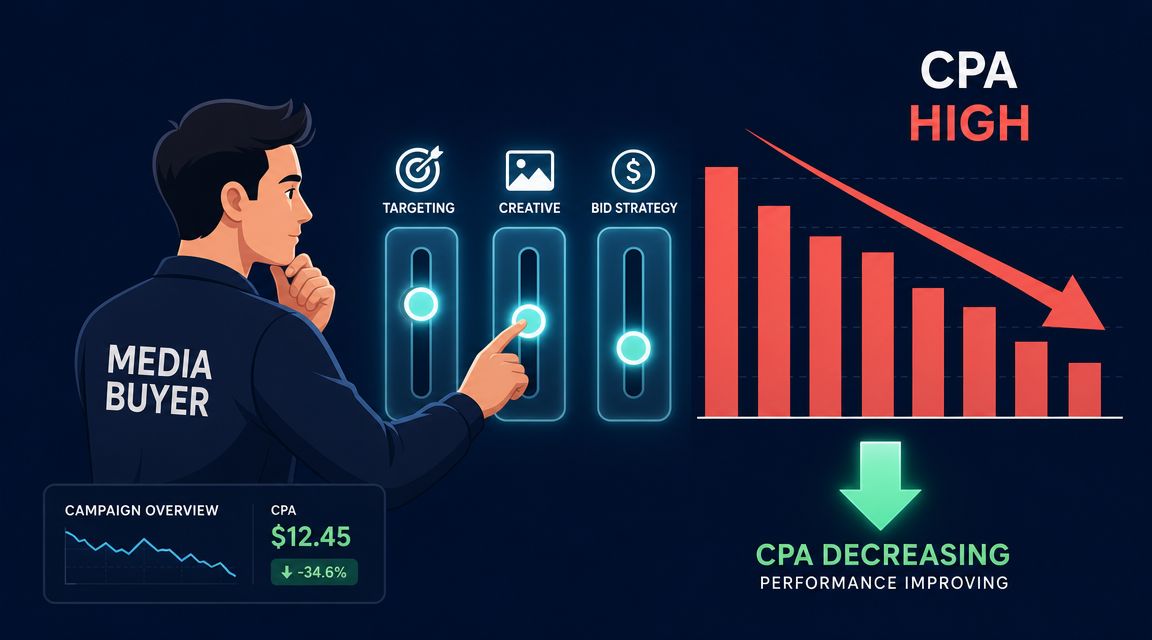
The forecast goes live on Monday. By Wednesday, CPA is running above plan. The fastest way to get control is to stop asking for a generic fix and identify which assumption broke first.
That is how lower costs happen in an account. A Facebook ad cost estimator gives you a target range for CPM, CTR, and conversion rate across best, base, and worst-case outcomes. Once delivery starts, the job is to compare live performance against those ranges and decide which layer needs intervention now, not after another week of wasted spend.
Find the weak point in the forecast
A high CPA usually comes from one of three places:
- CPM came in above forecast. You are paying more to reach the audience than the model allowed.
- CTR missed the base case. The ad is not earning enough clicks to offset media cost.
- Conversion rate fell toward the worst case. Traffic is arriving, but too little of it turns into the outcome you pay for.
In practice, I map those misses against the scenario model before changing anything. If CPM is sitting near the worst case but CTR and CVR are holding at base case, forcing more budget into the same setup usually makes the problem worse. If CPM is acceptable and CTR is the miss, creative gets priority. If CTR is healthy and CPA is still inflated, the post-click path needs attention first.
The point is simple. Cost reduction starts with diagnosis.
Use scenario bands to decide what to fix first
An estimator is useful because it tells you what kind of improvement the account needs. It also tells you what not to waste time on.
If your base case assumed a mid-range CTR and live performance is tracking well below it, a landing page rewrite will not rescue the campaign fast enough. If CTR is beating plan and conversion rate is collapsing, launching ten more creatives is activity, not problem solving. The scenario model keeps the team honest because each fix ties back to a failed assumption.
A practical order usually looks like this:
- Fix creative when CTR is below plan. New hooks, stronger first-frame visuals, clearer offers, and tighter message match usually change cost faster than account-level tweaks.
- Fix audience quality when click volume looks fine but downstream efficiency does not. Sharper exclusions, better prospecting segments, or cleaner retargeting logic can improve conversion rate without chasing cheap traffic.
- Fix delivery choices when spend distribution is distorting the model. Placement mix, bid strategy, and campaign structure matter when one pocket of inventory is consuming budget without supporting results.
What lowers costs versus what only feels active
Some account changes create motion without improving economics.
| Common reaction | What actually happens |
|---|---|
| Editing creative, audience, and budget at the same time | You lose the read on which variable changed performance |
| Cutting spend after the first rough patch | You delay learning and keep the forecast untested |
| Assuming every cost problem is auction pressure | Weak creative and weak traffic quality stay hidden |
| Scaling an ad set that barely works at small spend | Marginal efficiency breaks faster under more budget |
A better operating habit is to make one clear adjustment, set a read window, and compare the result against the estimator's scenario bands. That is how teams shorten the path from forecast to validated insight.
Lower costs by validating assumptions faster
The estimator should also speed up testing. If the model only works when CTR reaches the top of your expected range, that becomes a testing brief. The team needs enough creative variation in market to find out quickly whether that outcome is realistic.
The same logic applies to conversion rate. If the base case depends on a clean post-click experience, run tests that can confirm or reject that assumption early. Faster validation reduces wasted spend because poor scenarios get ruled out sooner, and workable ones get budget before the auction shifts again.
The practical goal is not to make the spreadsheet look smarter. The goal is to turn best, base, and worst-case planning into faster decisions in the account. Lower ad costs usually come from that discipline. You find the broken assumption, test the fix quickly, and scale only after the live numbers support the model.
Scale Your Ad Testing and Outpace the Auction
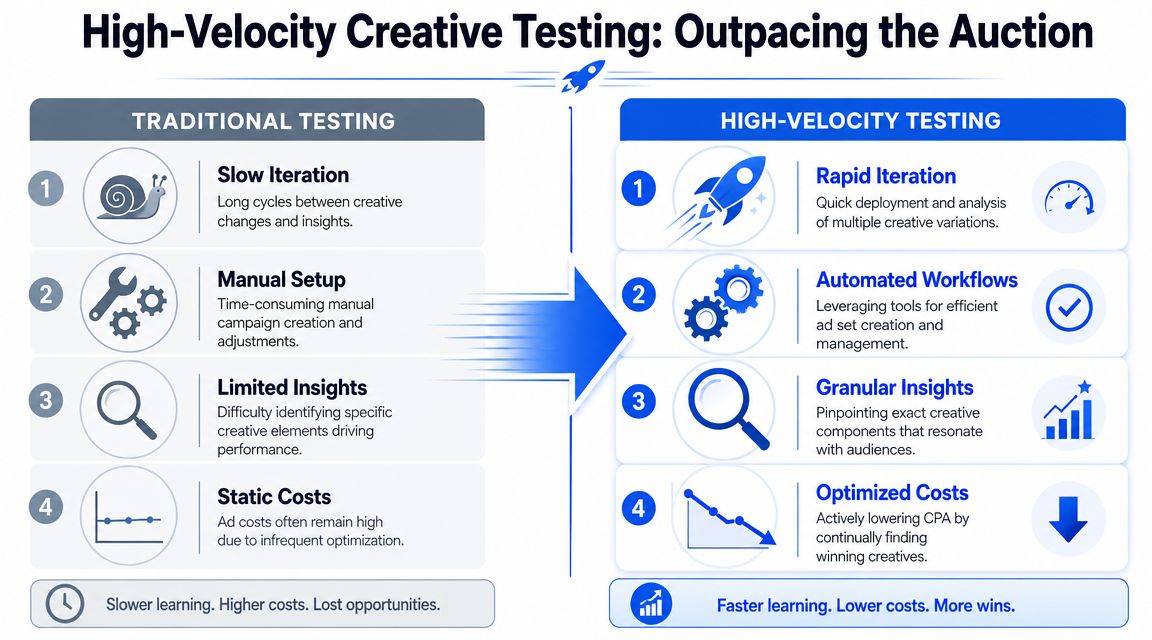
Initial estimates are not beaten by building more elaborate spreadsheets. They are beaten by validating assumptions faster than the auction changes.
If your forecast says the model needs stronger CTR to work, the answer isn't debate. The answer is more creative in market, faster read cycles, cleaner reporting, and less operational drag between insight and launch.
Why testing speed beats prettier spreadsheets
A Facebook ad cost estimator is a hypothesis engine. High-velocity testing is how you confirm or reject the hypothesis.
That matters because the biggest assumption in most models isn't CPM. It's creative performance. If the campaign needs a stronger CTR or better conversion behavior to hit target CPA, you need enough live variation in market to find out which concept can do that.
Teams that test quickly usually gain four advantages:
- They isolate signal sooner. Better creative gets identified before budget is wasted on laggards.
- They update forecasts faster. Live inputs replace speculative ones sooner.
- They spot fatigue earlier. The model stays current instead of relying on stale winners.
- They make scaling decisions with evidence. Budget increases follow observed performance, not optimism.
Where manual workflow slows validation down
Native Ads Manager becomes a bottleneck once the testing agenda gets serious. Uploading creatives one by one, rebuilding naming conventions manually, and checking whether unwanted Advantage+ settings stayed off all slow the feedback loop. Reporting quality slips too, especially across multiple accounts or markets, because inconsistent naming makes clean analysis harder than it should be.
That's where workflow tooling earns its place. If your team is launching lots of creative variants, a platform like Rapid Ads helps for reasons that are operational, not cosmetic. Bulk uploading cuts setup time. Naming conventions stay consistent across ad sets and accounts. And if your team needs Advantage+ creative settings disabled, keeping those defaults under control avoids the silent drift that can distort testing.
The point isn't to launch more ads for the sake of volume. It's to shorten the time between forecast, test, read, and revision. That loop is how estimators become more accurate and campaigns become cheaper.
If your team is spending more time building ads than learning from them, Rapid Ads is worth a look. It's built for media buyers who need to upload creatives in bulk, keep naming clean across accounts, and stop losing time to repetitive Ads Manager setup while they're trying to validate cost assumptions quickly.
Enhanced by Outrank app
